View details about your source
This section provides a comprehensive guide on how to explore the details of your sources. It covers how to access general information about the dataset, as well as specific details about individual tables and columns. You’ll learn how to quickly view summary statistics, identify data types, and recognize sensitive information that may need to be synthesized.
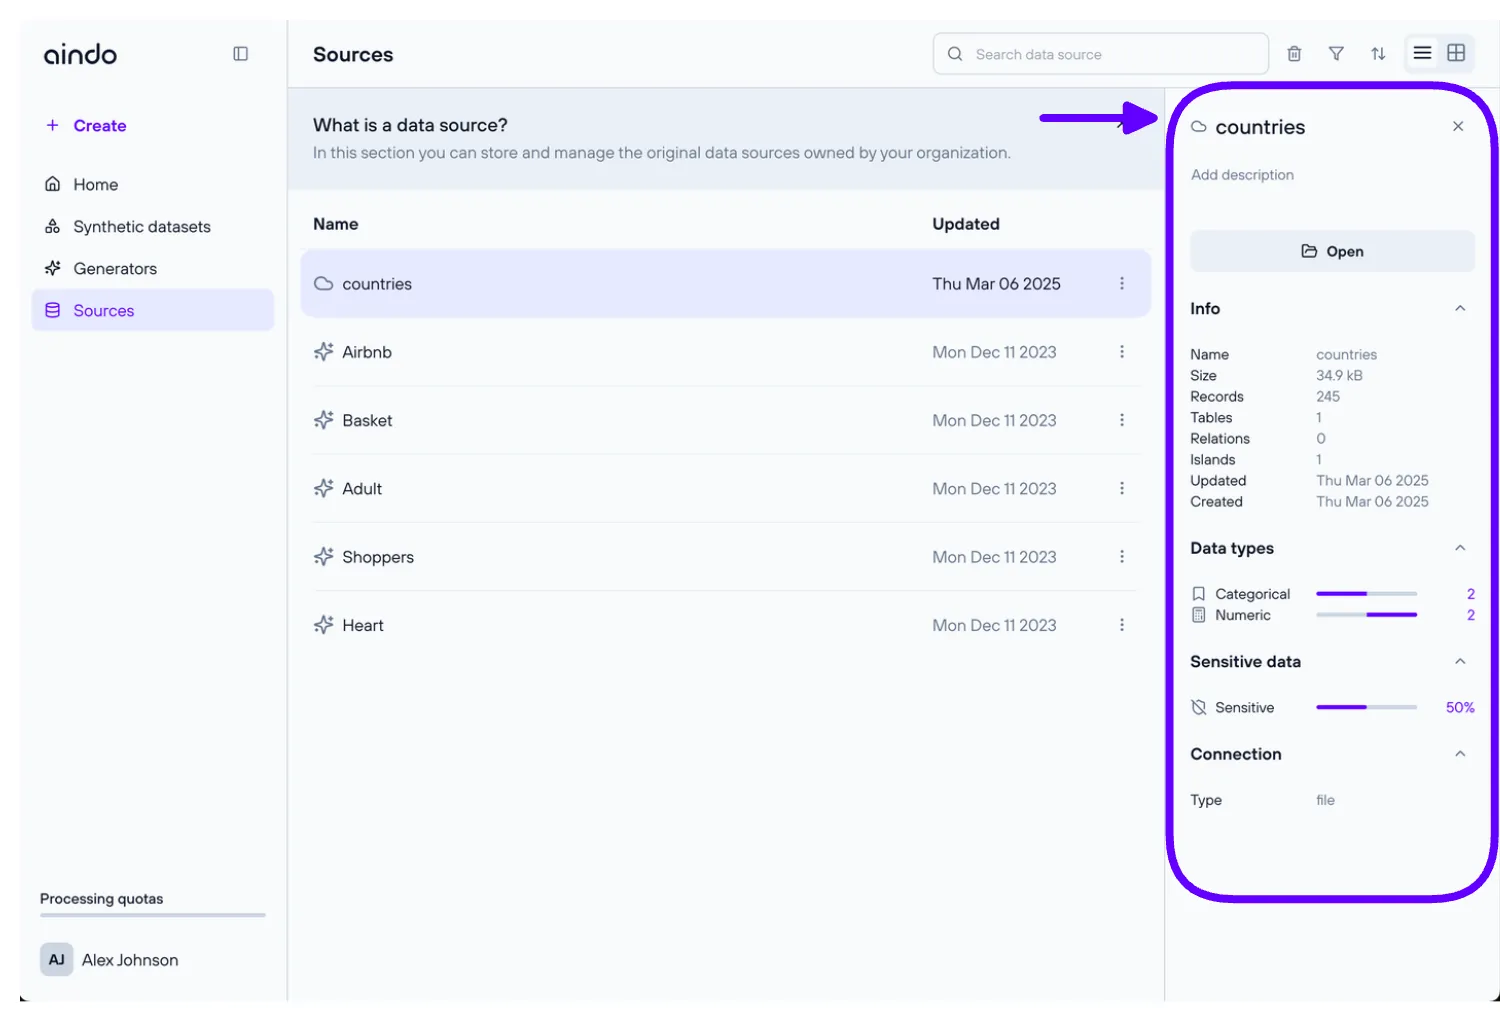
Quick details in list page
On the source list page, clicking on a source will display a side panel with general information about the dataset used to create the source.
View page
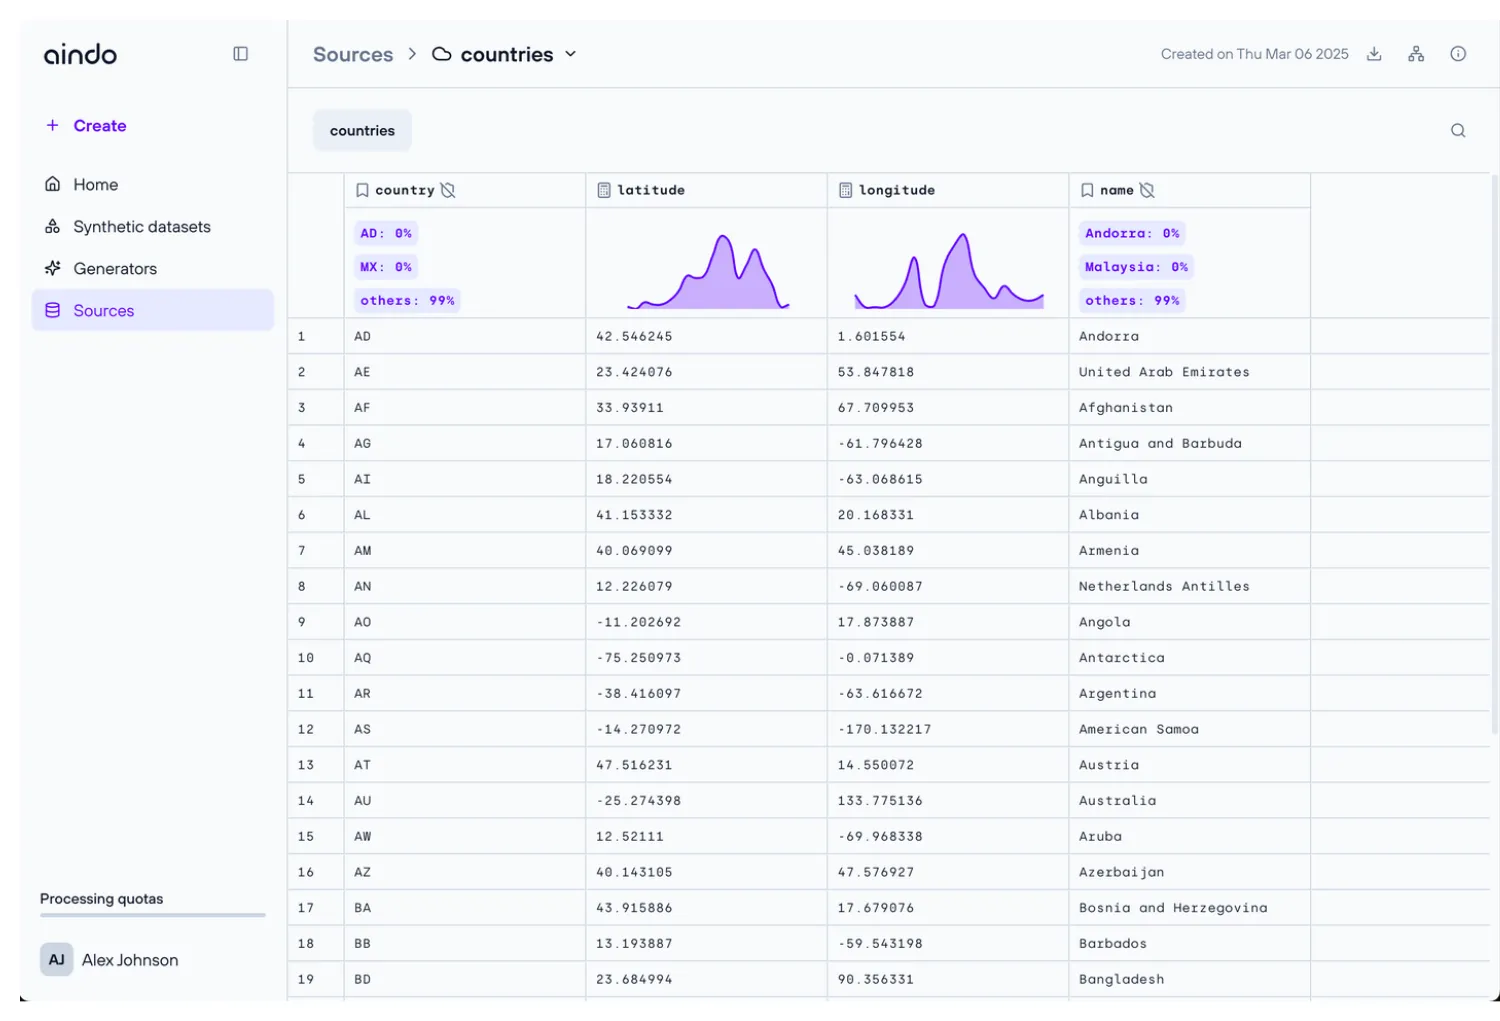
On the source list page, double-clicking on a source will navigate you to the view page of the selected source. Here, you can see the raw data.
Each column header provides additional information, such as the column type and a ‘shield’ icon. If the shield icon is present, it indicates that the column contains sensitive data.
Under each column, you will find a small chart summarizing key statistics specific to that column.
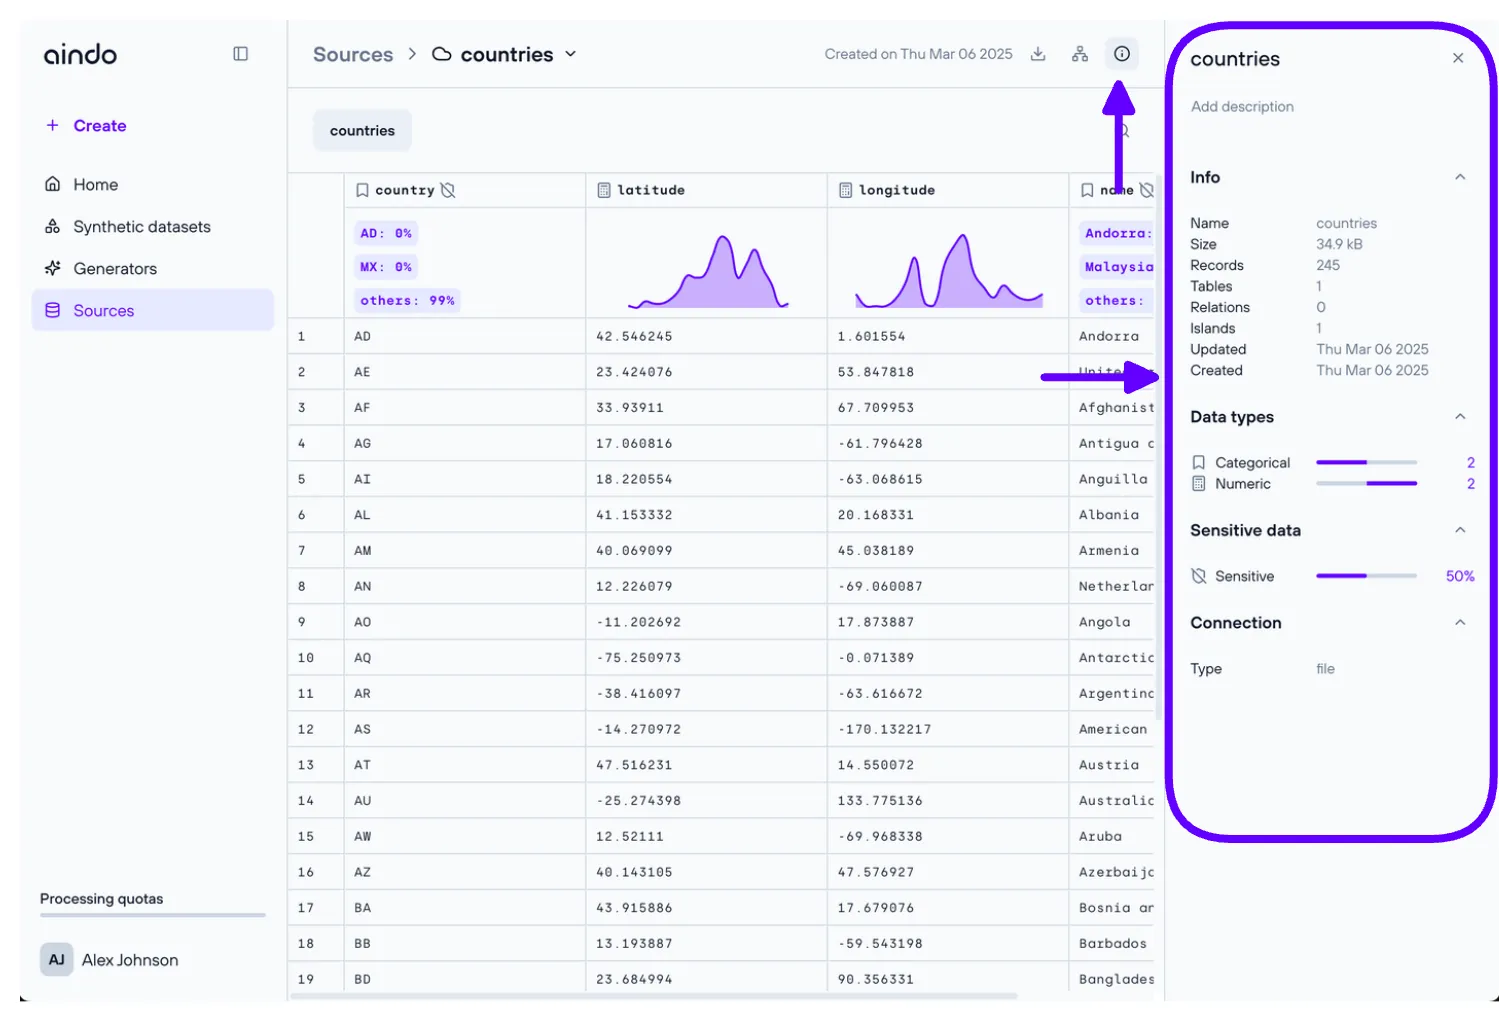
Quick details source
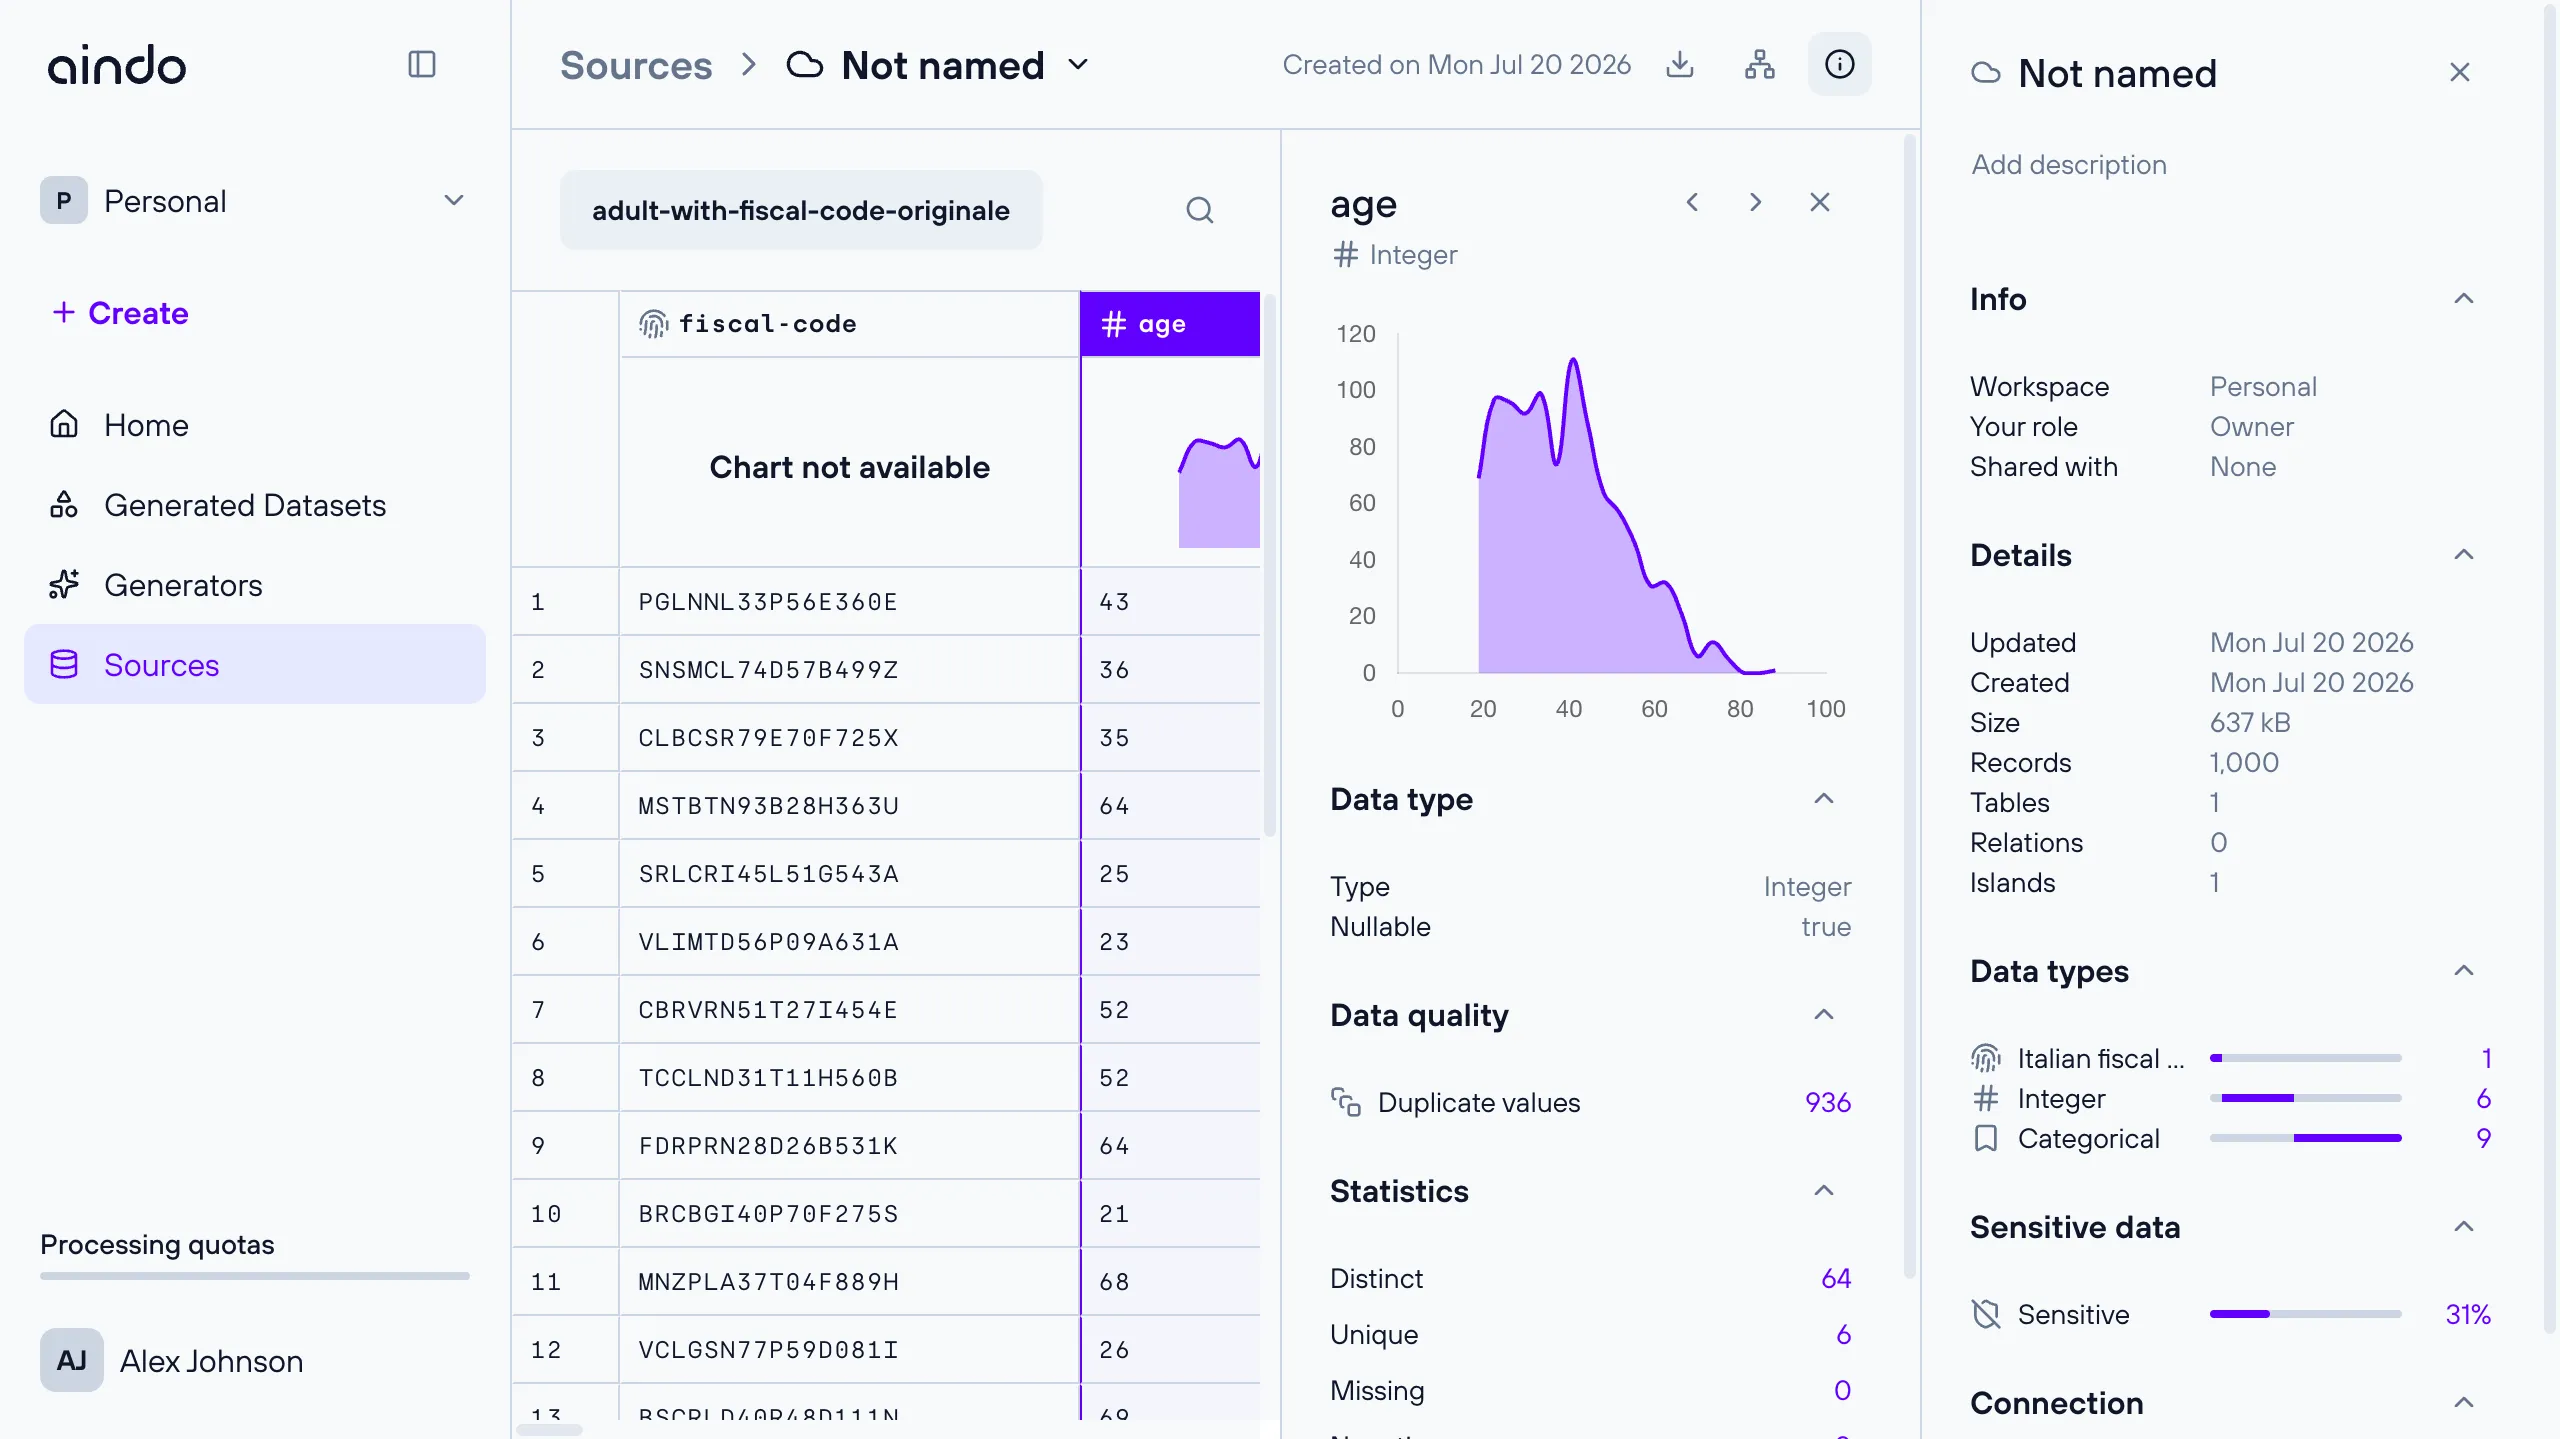
Clicking on the ‘info icon’ button, a side panel with general info about Data types, connection type and dataset info will appear.
Quick details column
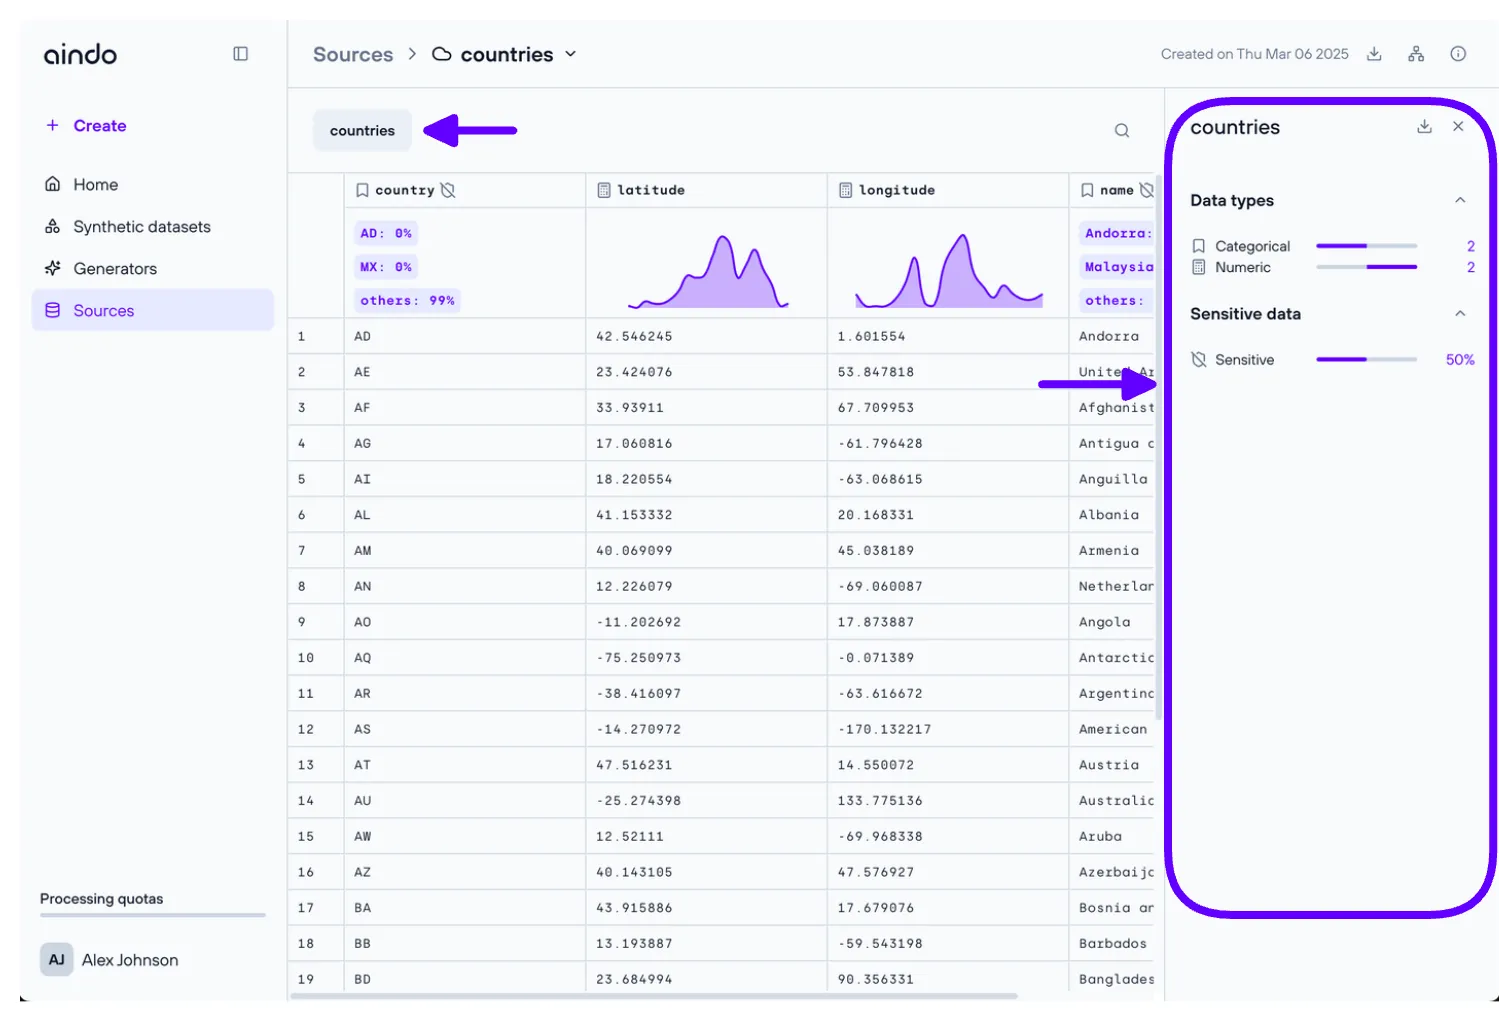
Clicking on a column opens a side panel with a column analysis for the selected column. The panel header shows the column name and its data type, and flags the column when it contains PII (labeled ‘Sensitive’, or ‘Protected’ if the column is also protected).
Below the header, the panel shows a distribution summary, data-quality indicators, and summary statistics for the column. What appears adapts to the column’s data type; for example, numeric columns show a histogram and value ranges, categorical columns show the most frequent category shares, and text columns show length statistics.
Quick details table
Clicking on a table, a side panel with more detailed information about the selected table will be displayed.