View details and evaluate generated dataset
The Aindo Synthetic Data Platform provides a preview of the generated dataset you created with a generator. It also includes evaluation metrics to assess both the quality and privacy protection of the generated generated datasets. Below is an overview of the viewing and evaluation features.
Quick details on the list page
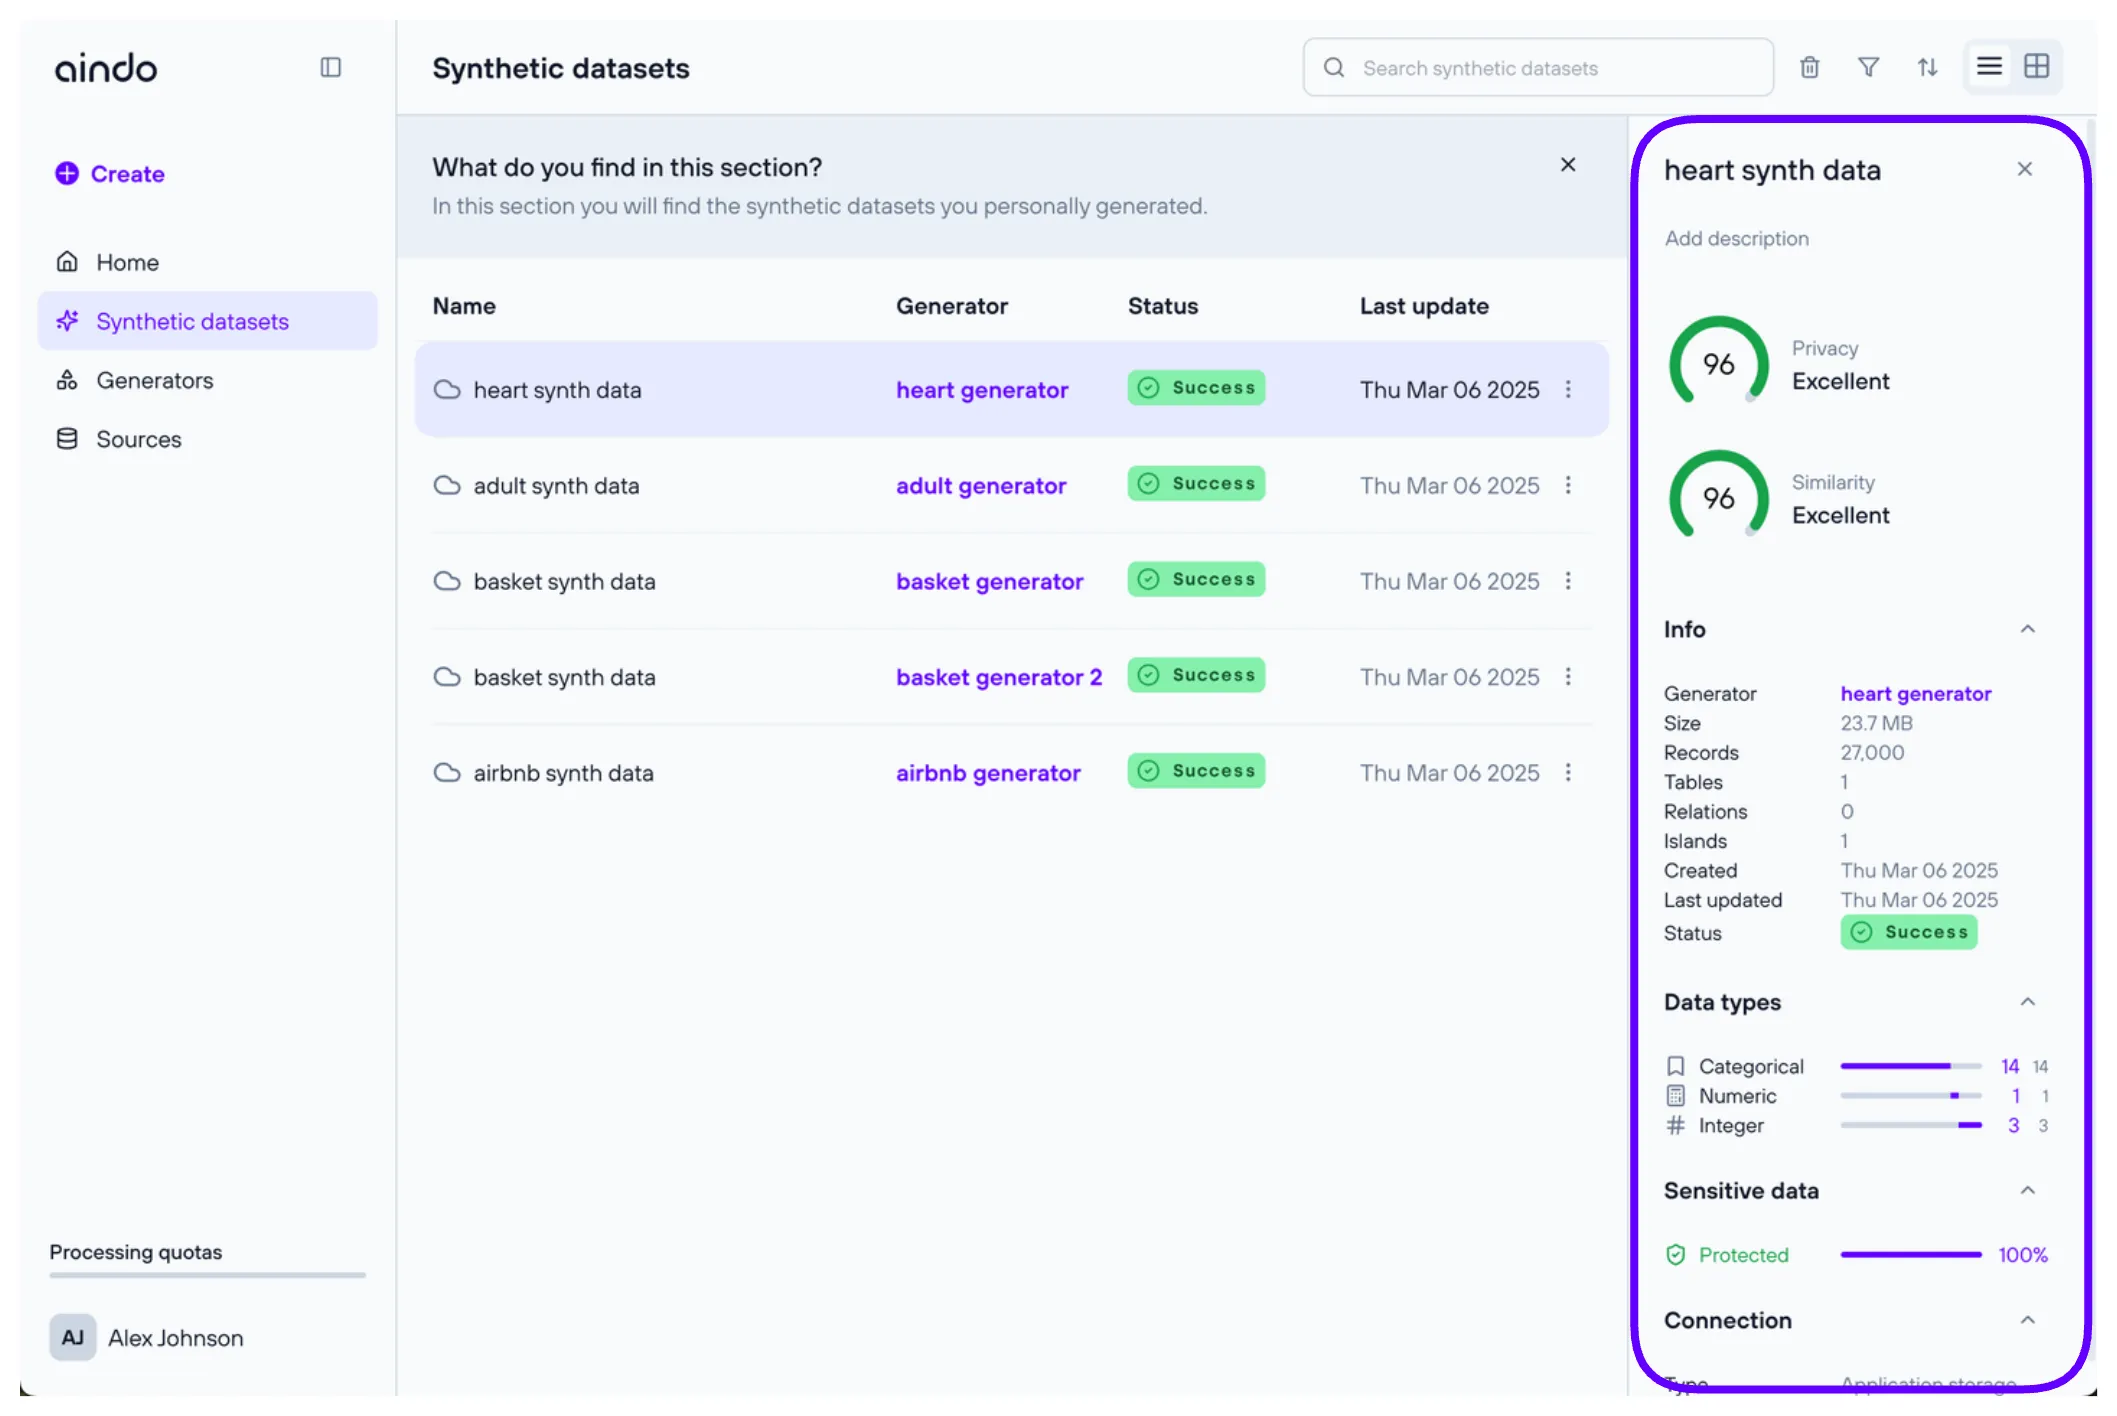
On the generated dataset list page, click on a generated dataset to open a side panel displaying general information, including evaluation scores, the generator used, and data types.
View page
To open a generated dataset, double-click on it from the list page.
Generation Stages
Click the “Generation stages” icon in the top right corner of the view page to open the “Generation Stages” dialog, listing every stage of the generation pipeline:
- Data Loading
- Tabular Preprocessing
- Text Preprocessing
- Tabular Synthesis
- Report
- Text Synthesis
- Anonymization (anonymization generators only)
- Data Writing
Not every stage applies to every generator: text stages only appear when the source data has textual columns, and the Anonymization stage only applies to anonymization generators.
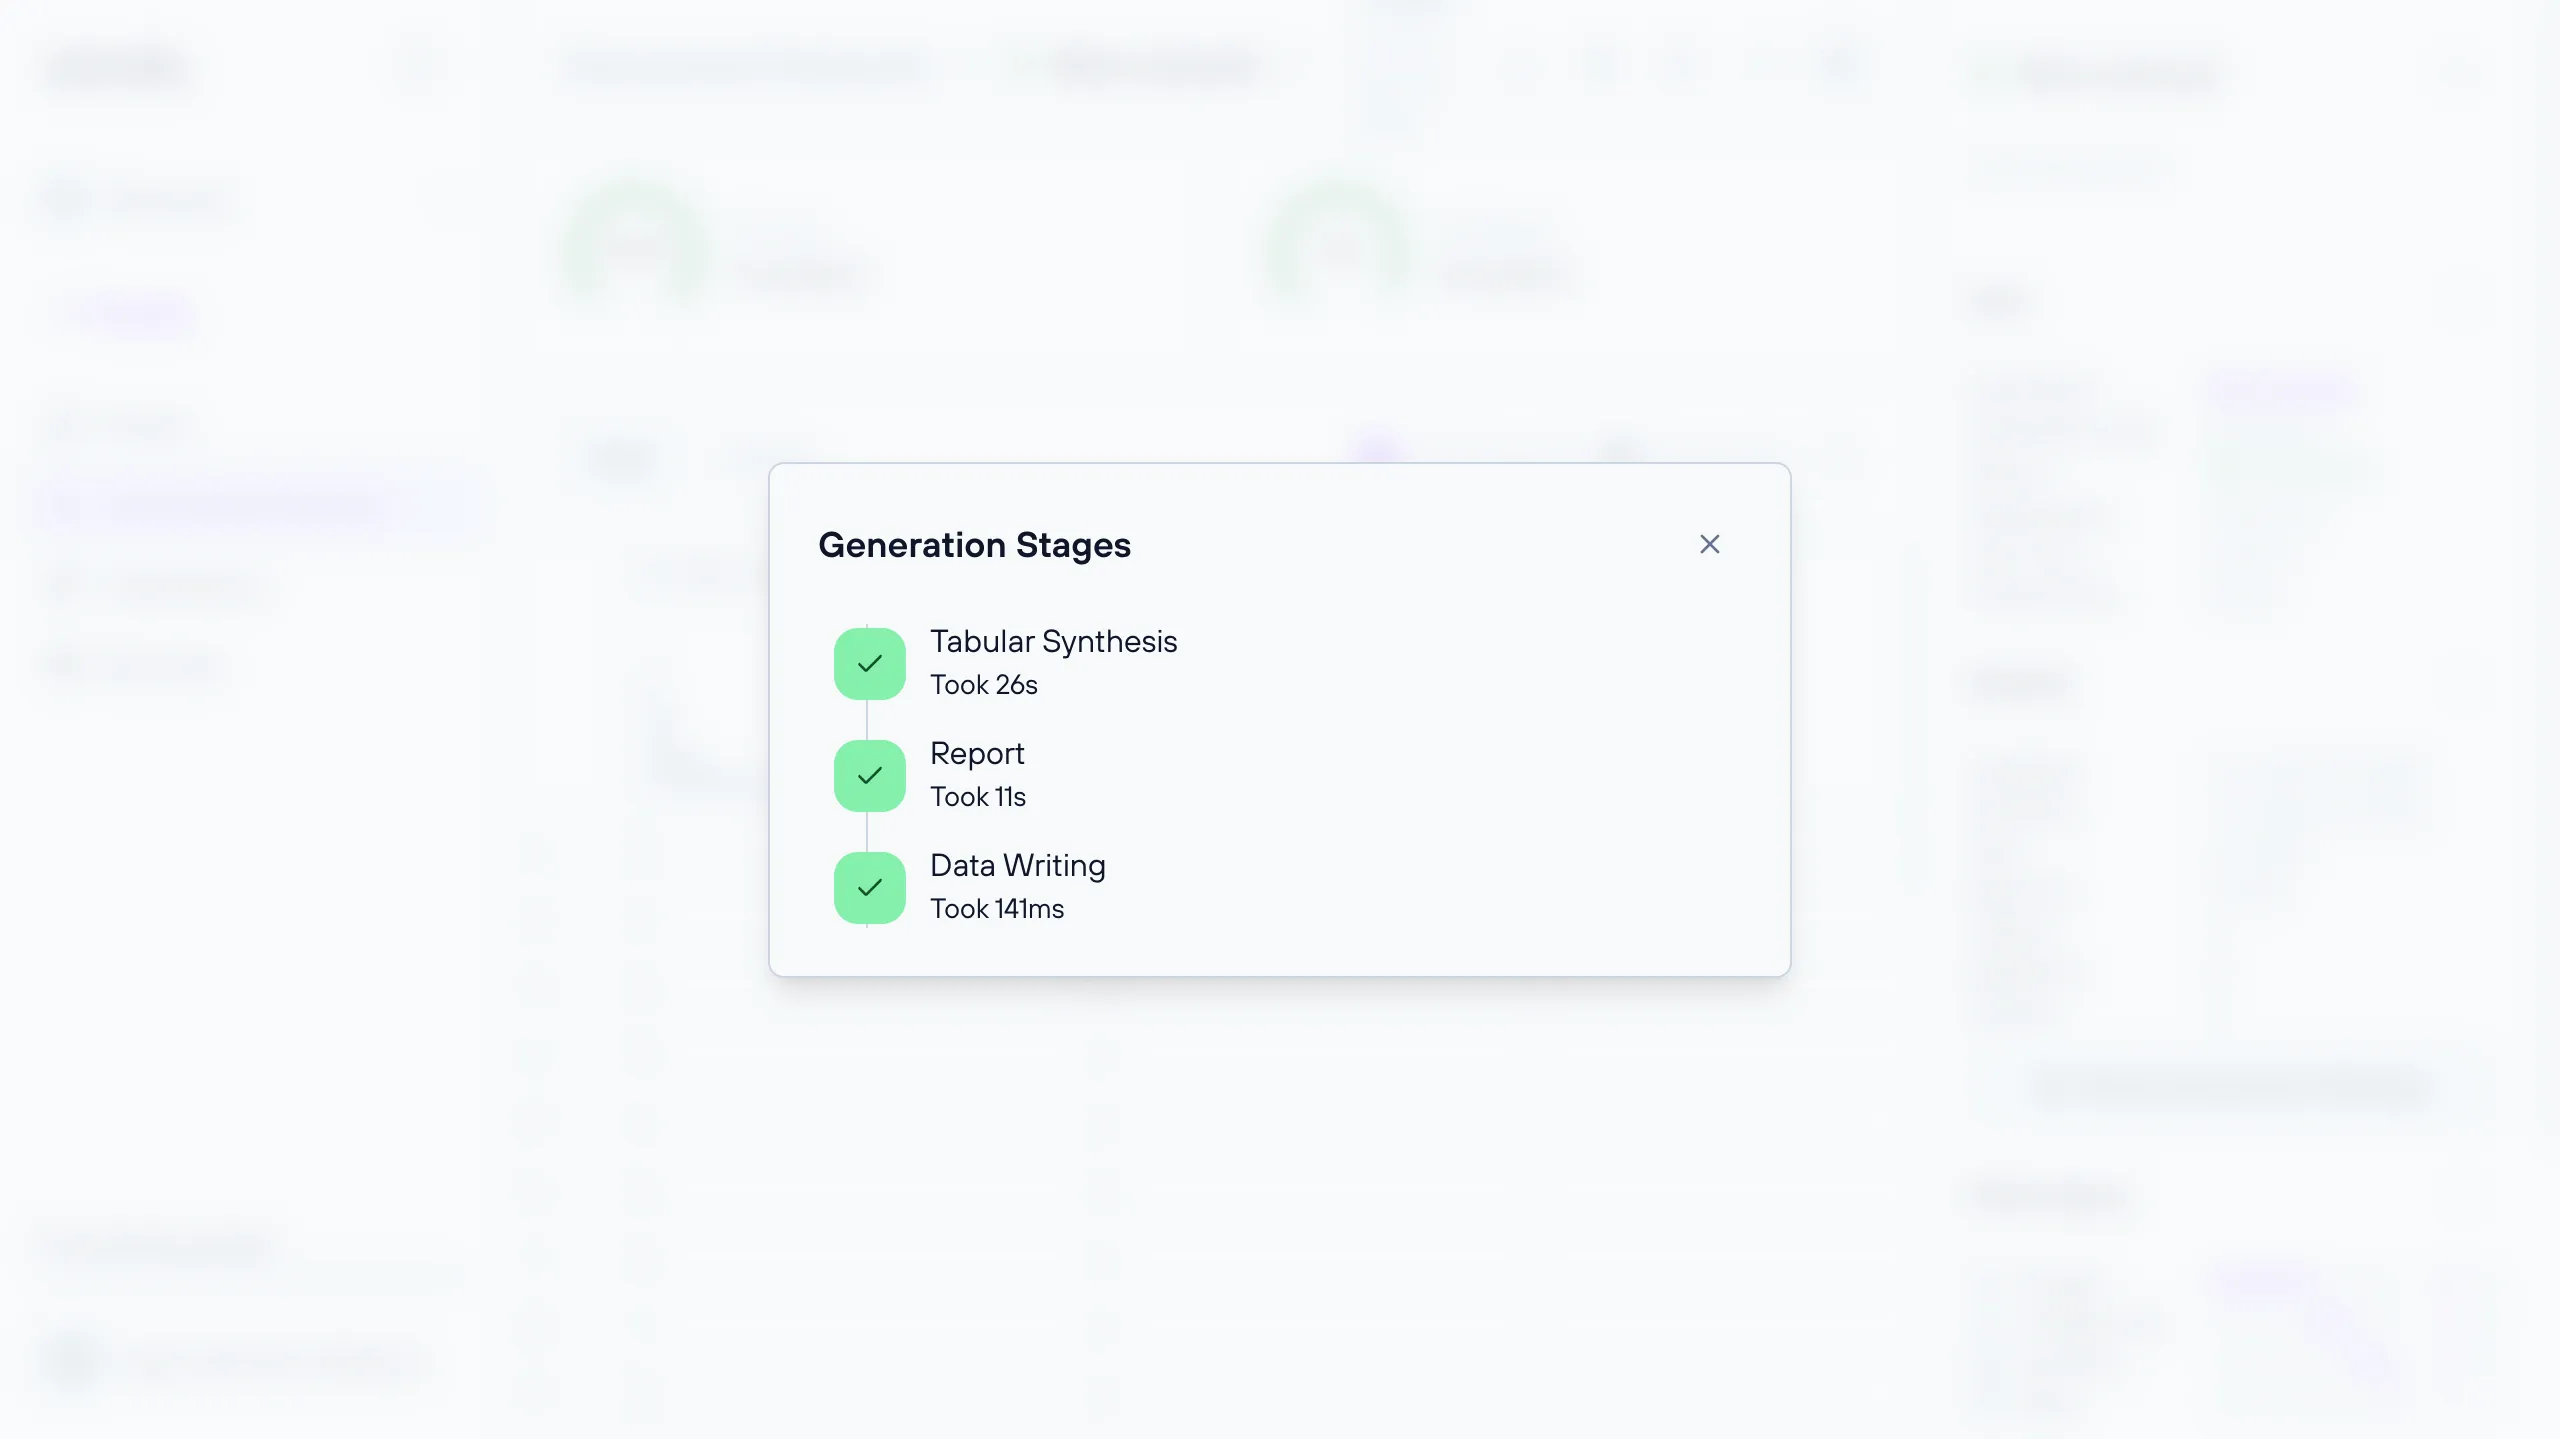
For each stage, the dialog shows:
Pending, if the stage has not started yet.Elapsed time: <duration>while the stage is running, orTook <duration>once it has finished.AbortedorErrorif the stage did not complete successfully.
This same stage timeline is also shown inline on the view page itself, in place of the data preview, while a generation is pending, running, cancelled, or failed.
Cancelling a generation
While a generation is pending or running, a ‘Cancel’ button below the stage timeline lets you abort it. Clicking it opens a confirmation dialog.
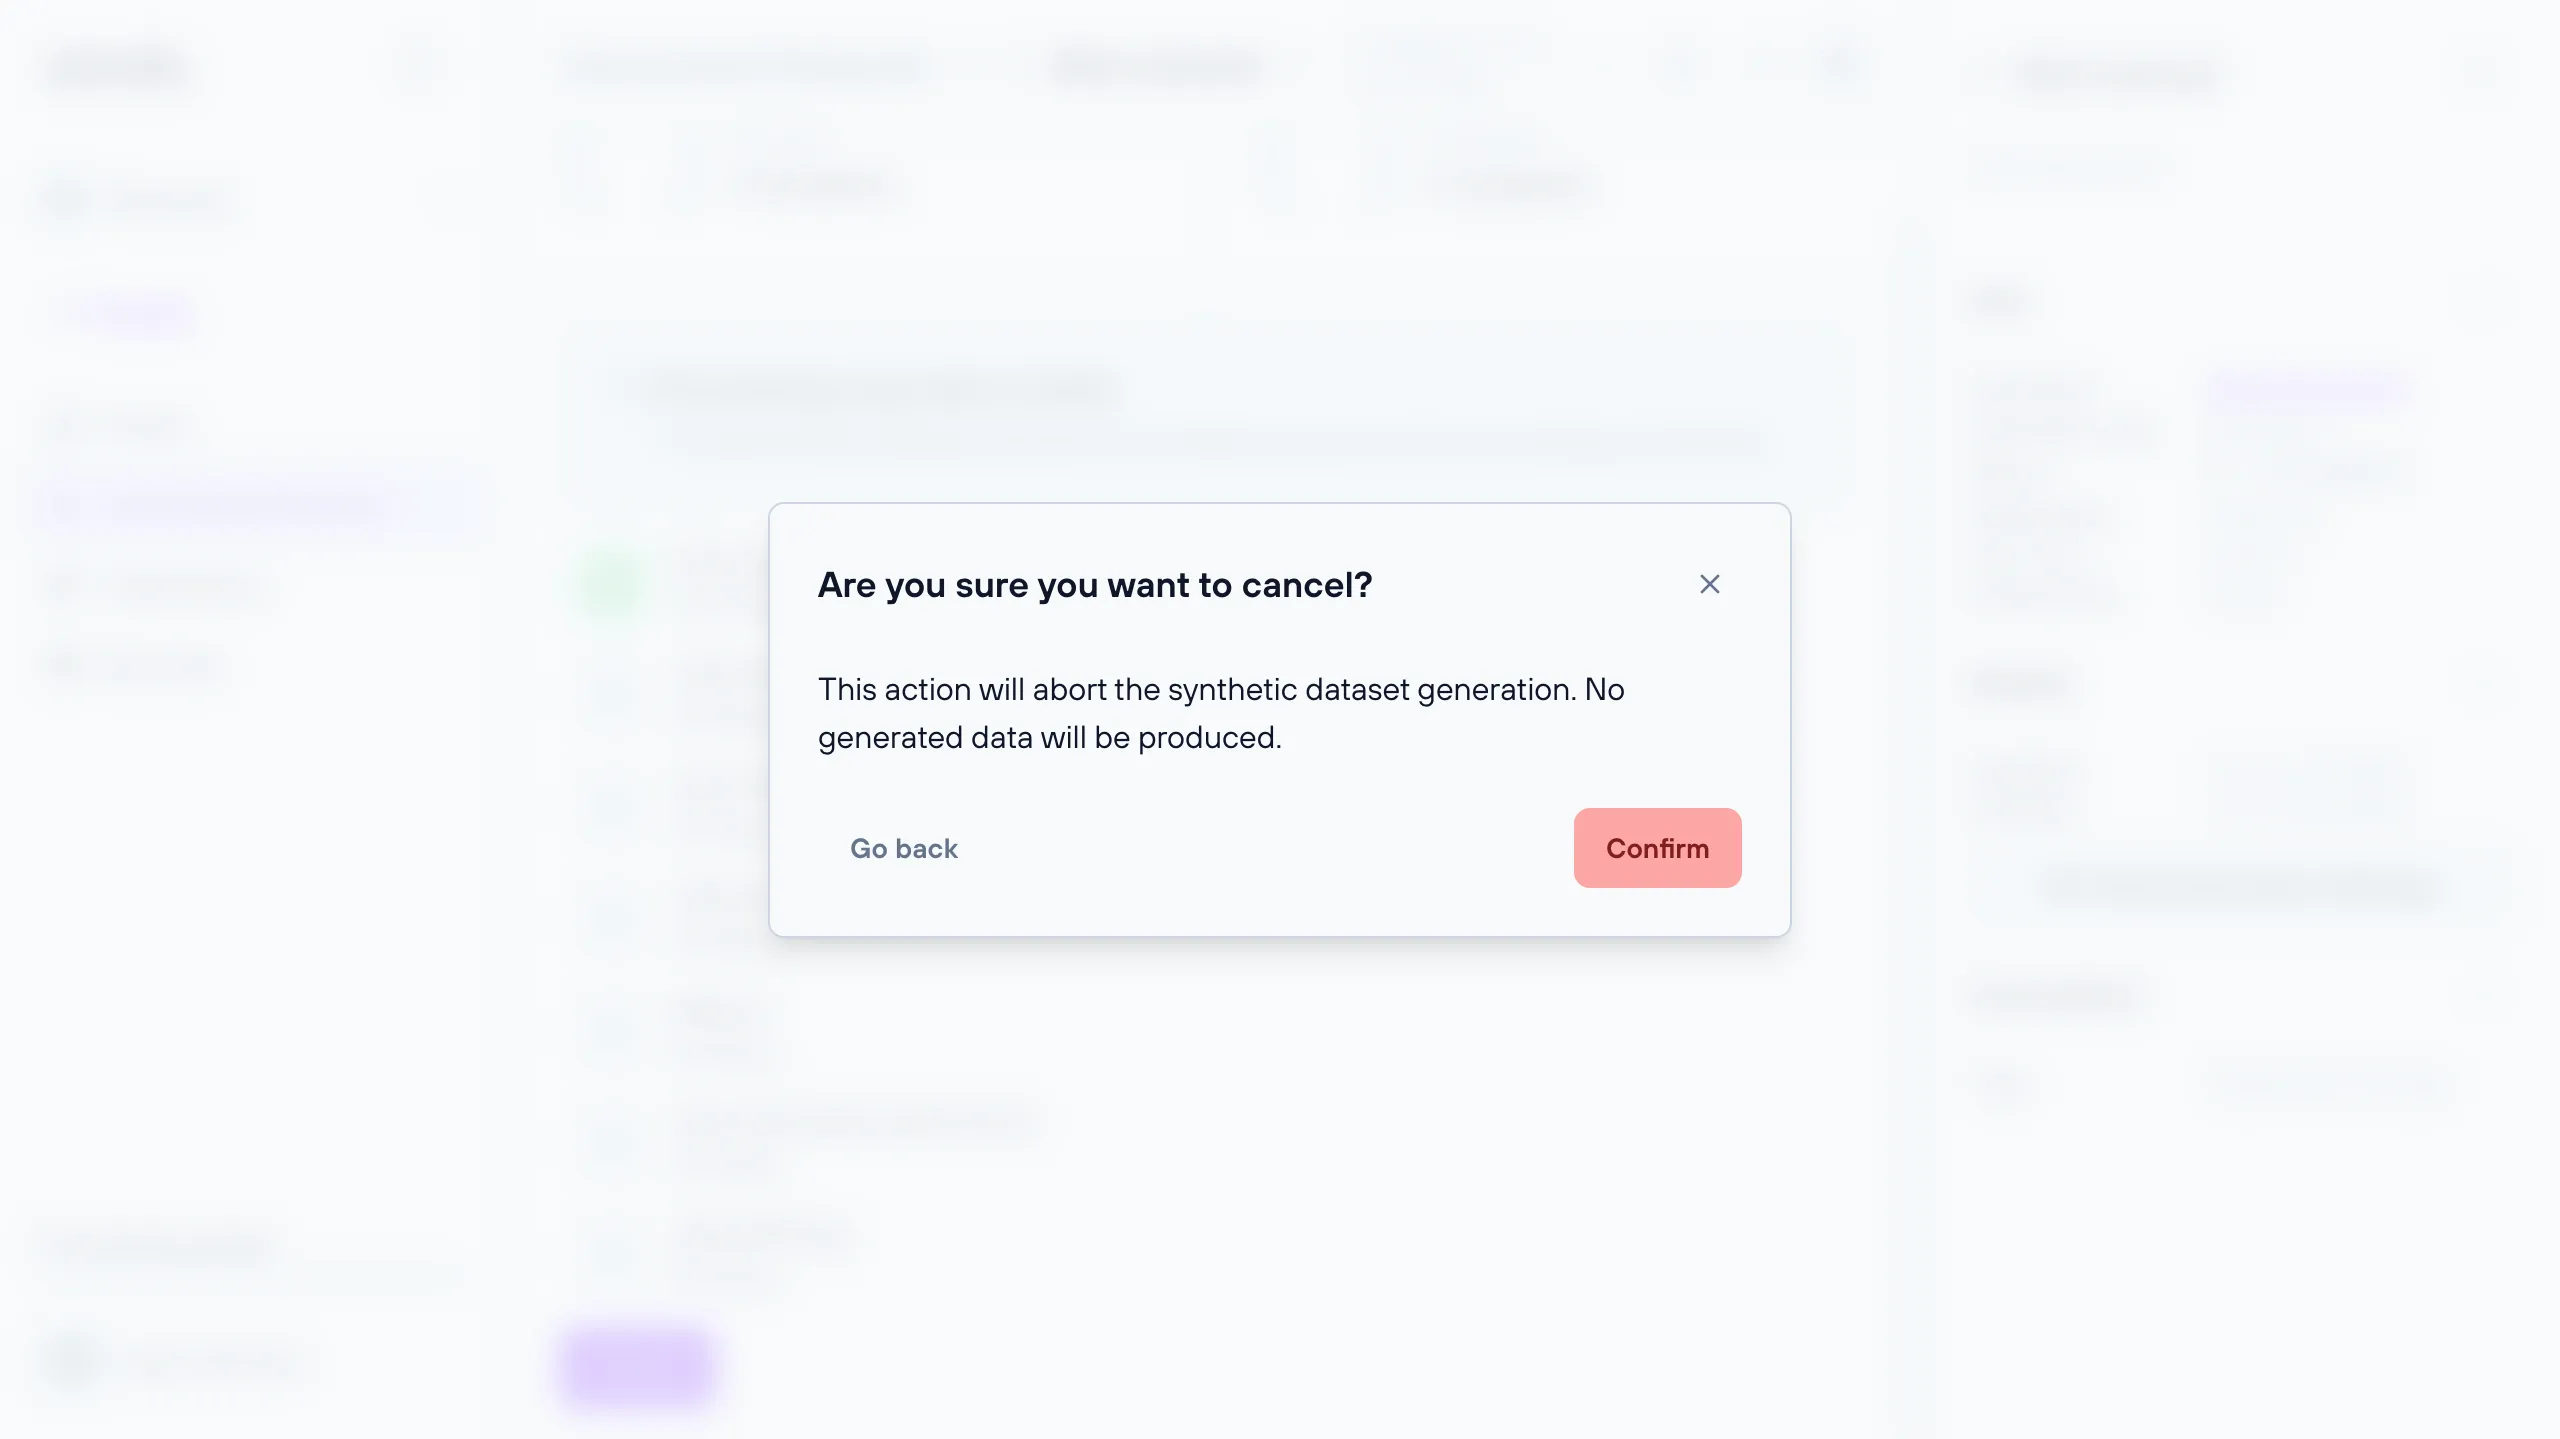
Confirming the dialog aborts the generation; no generated data will be produced, and no data preview will be available for this generated dataset.
Evaluation scores
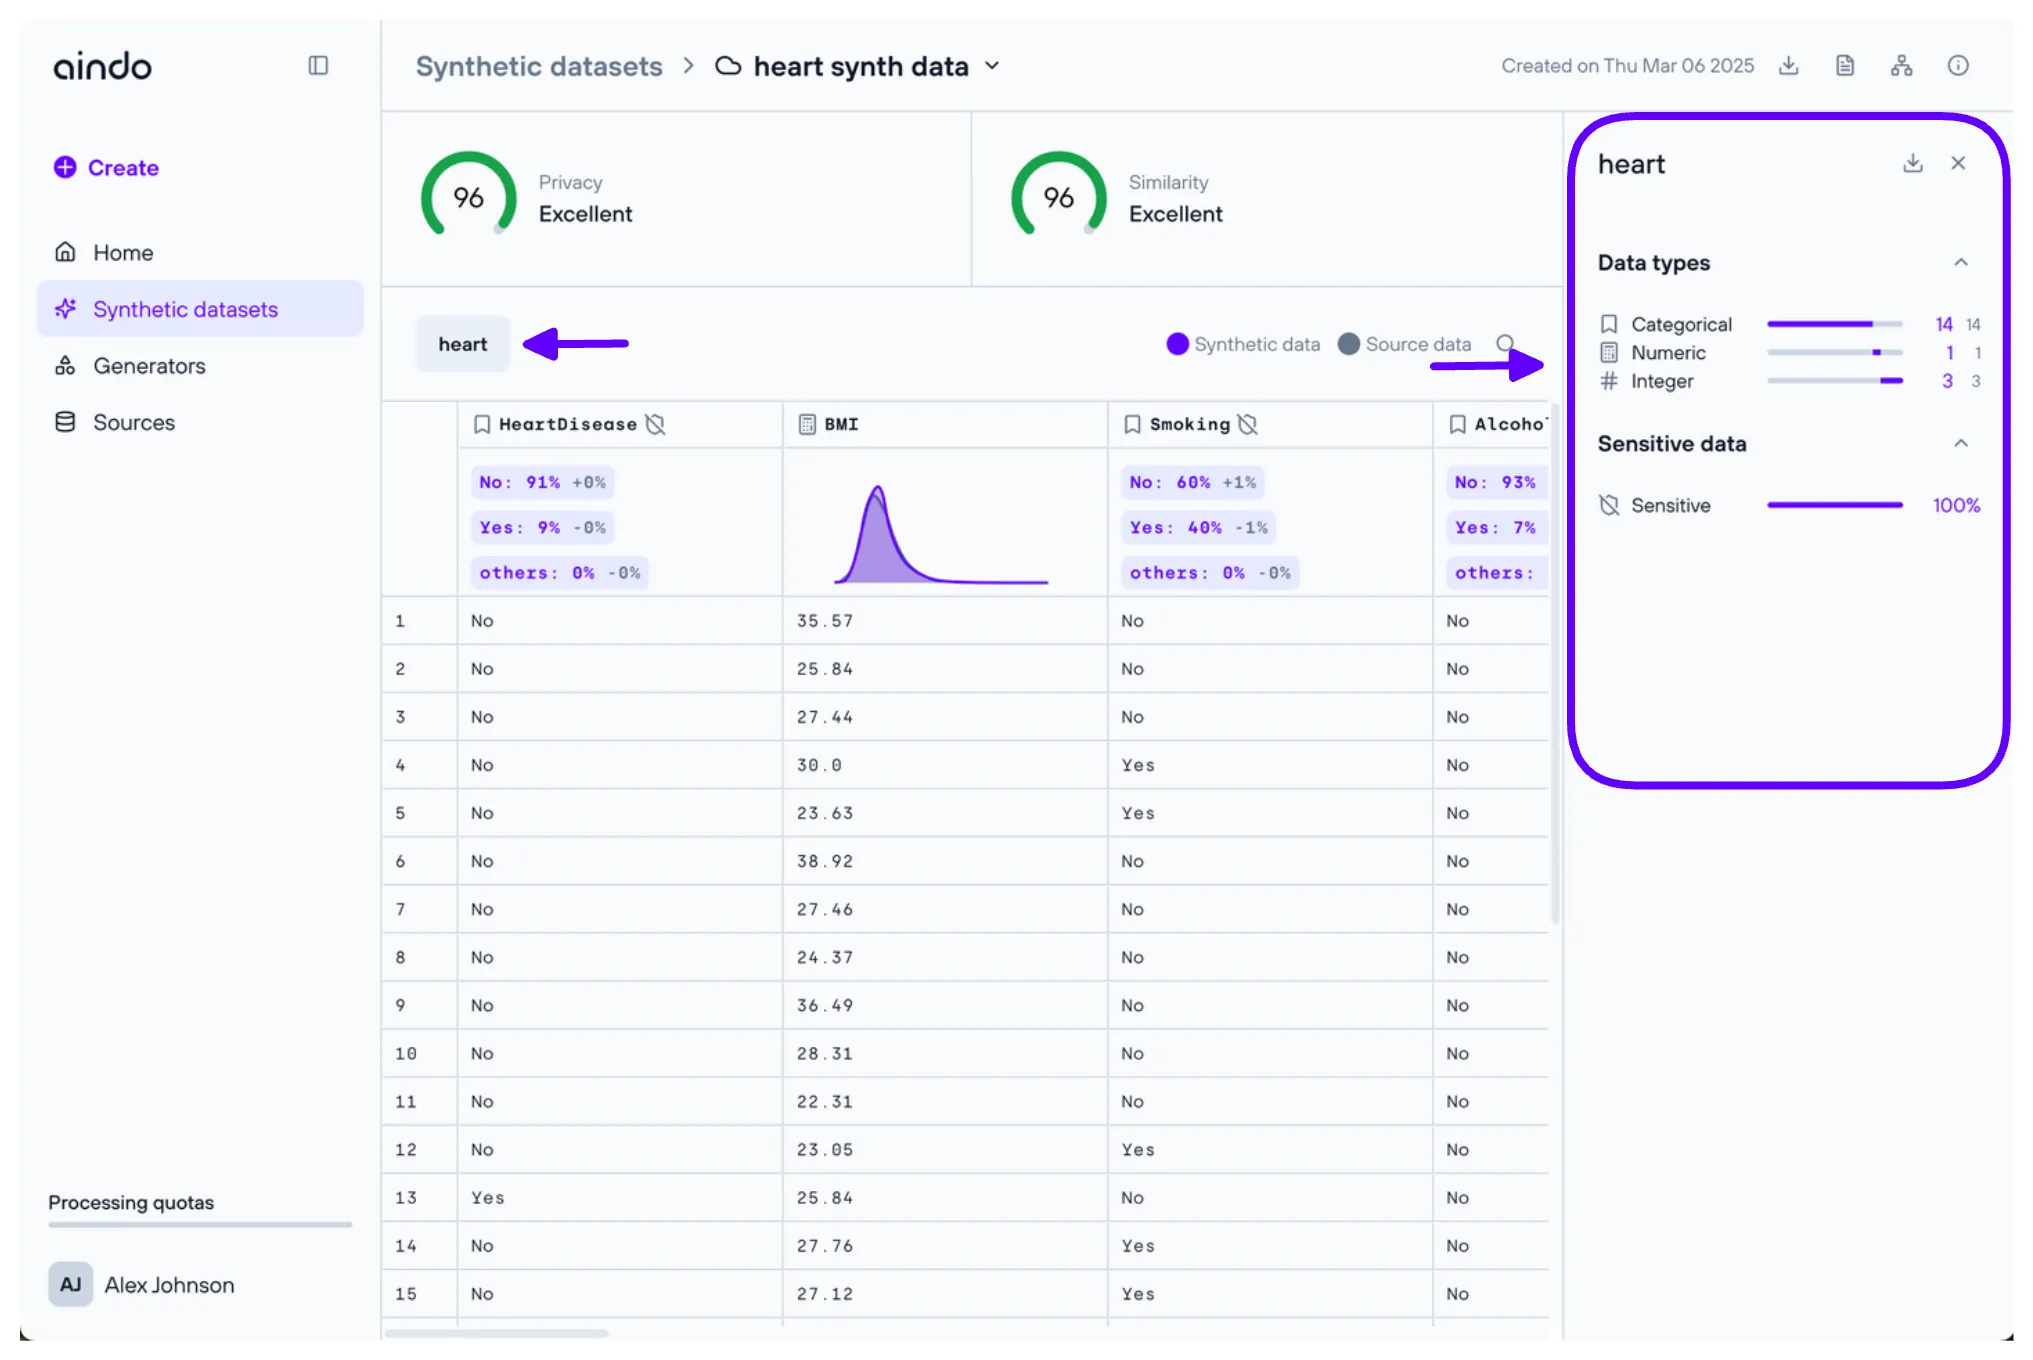
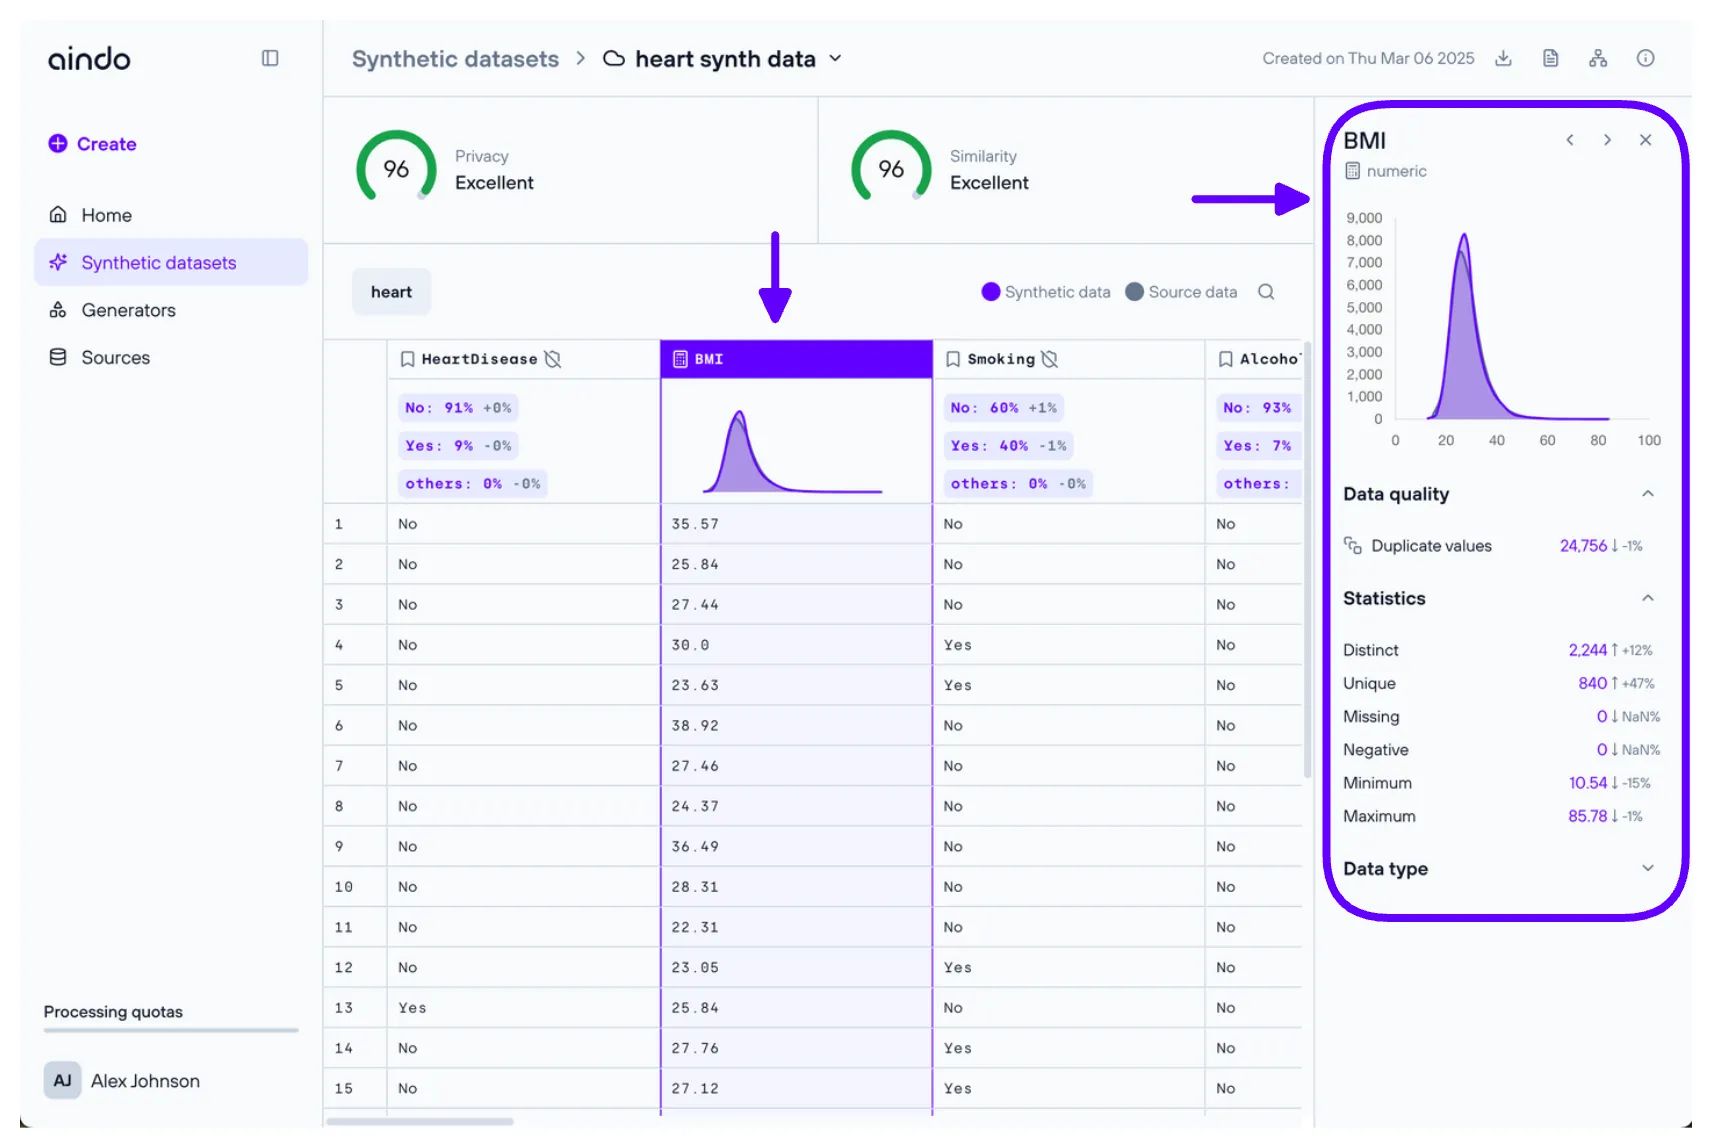
At the top of the generated dataset view page, once generation has completed, two important metrics provide insights into the quality of the generated data:
- Privacy score: Indicates how well the generated synthetic data protects the privacy of real data subjects on a scale from 0 (all private information leaked) to 100 (no private information leaked). The privacy score is based on similarity metrics, a widely accepted approach to measuring privacy protection in synthetic and anonymized datasets.
- Similarity score: Indicates how well the synthetic data preserves the properties of the real data source on a scale from 0 (no information preserved) to 100 (all information relevant in analytics, software testing, research, AI development preserved). The similarity score is an aggregation of multiple widely accepted data fidelity and utility metrics.
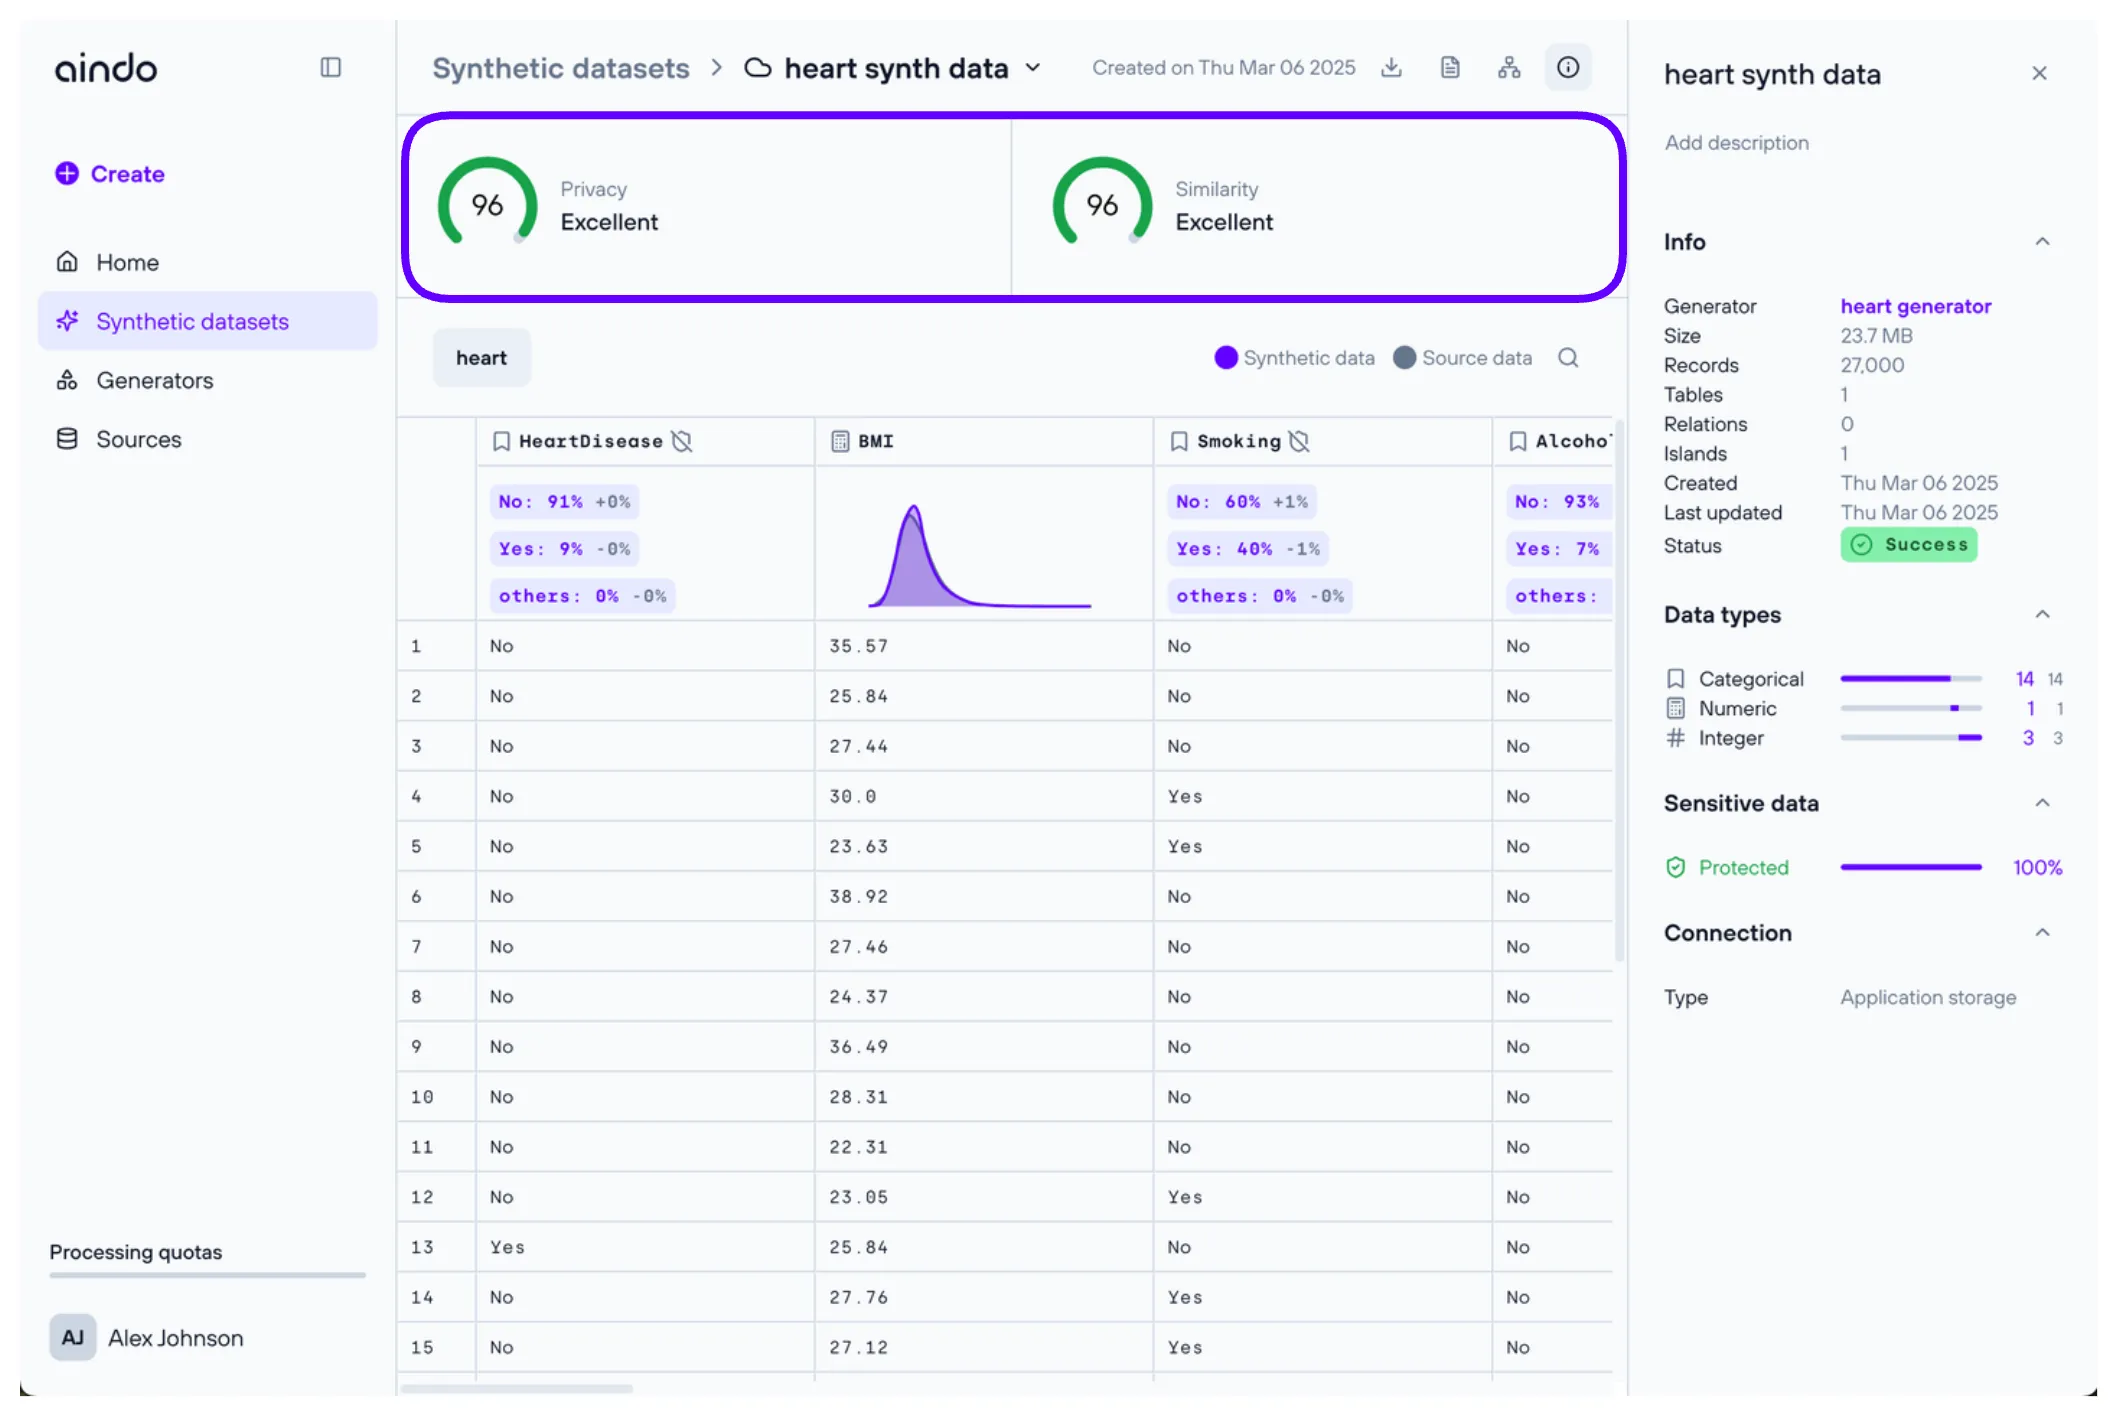
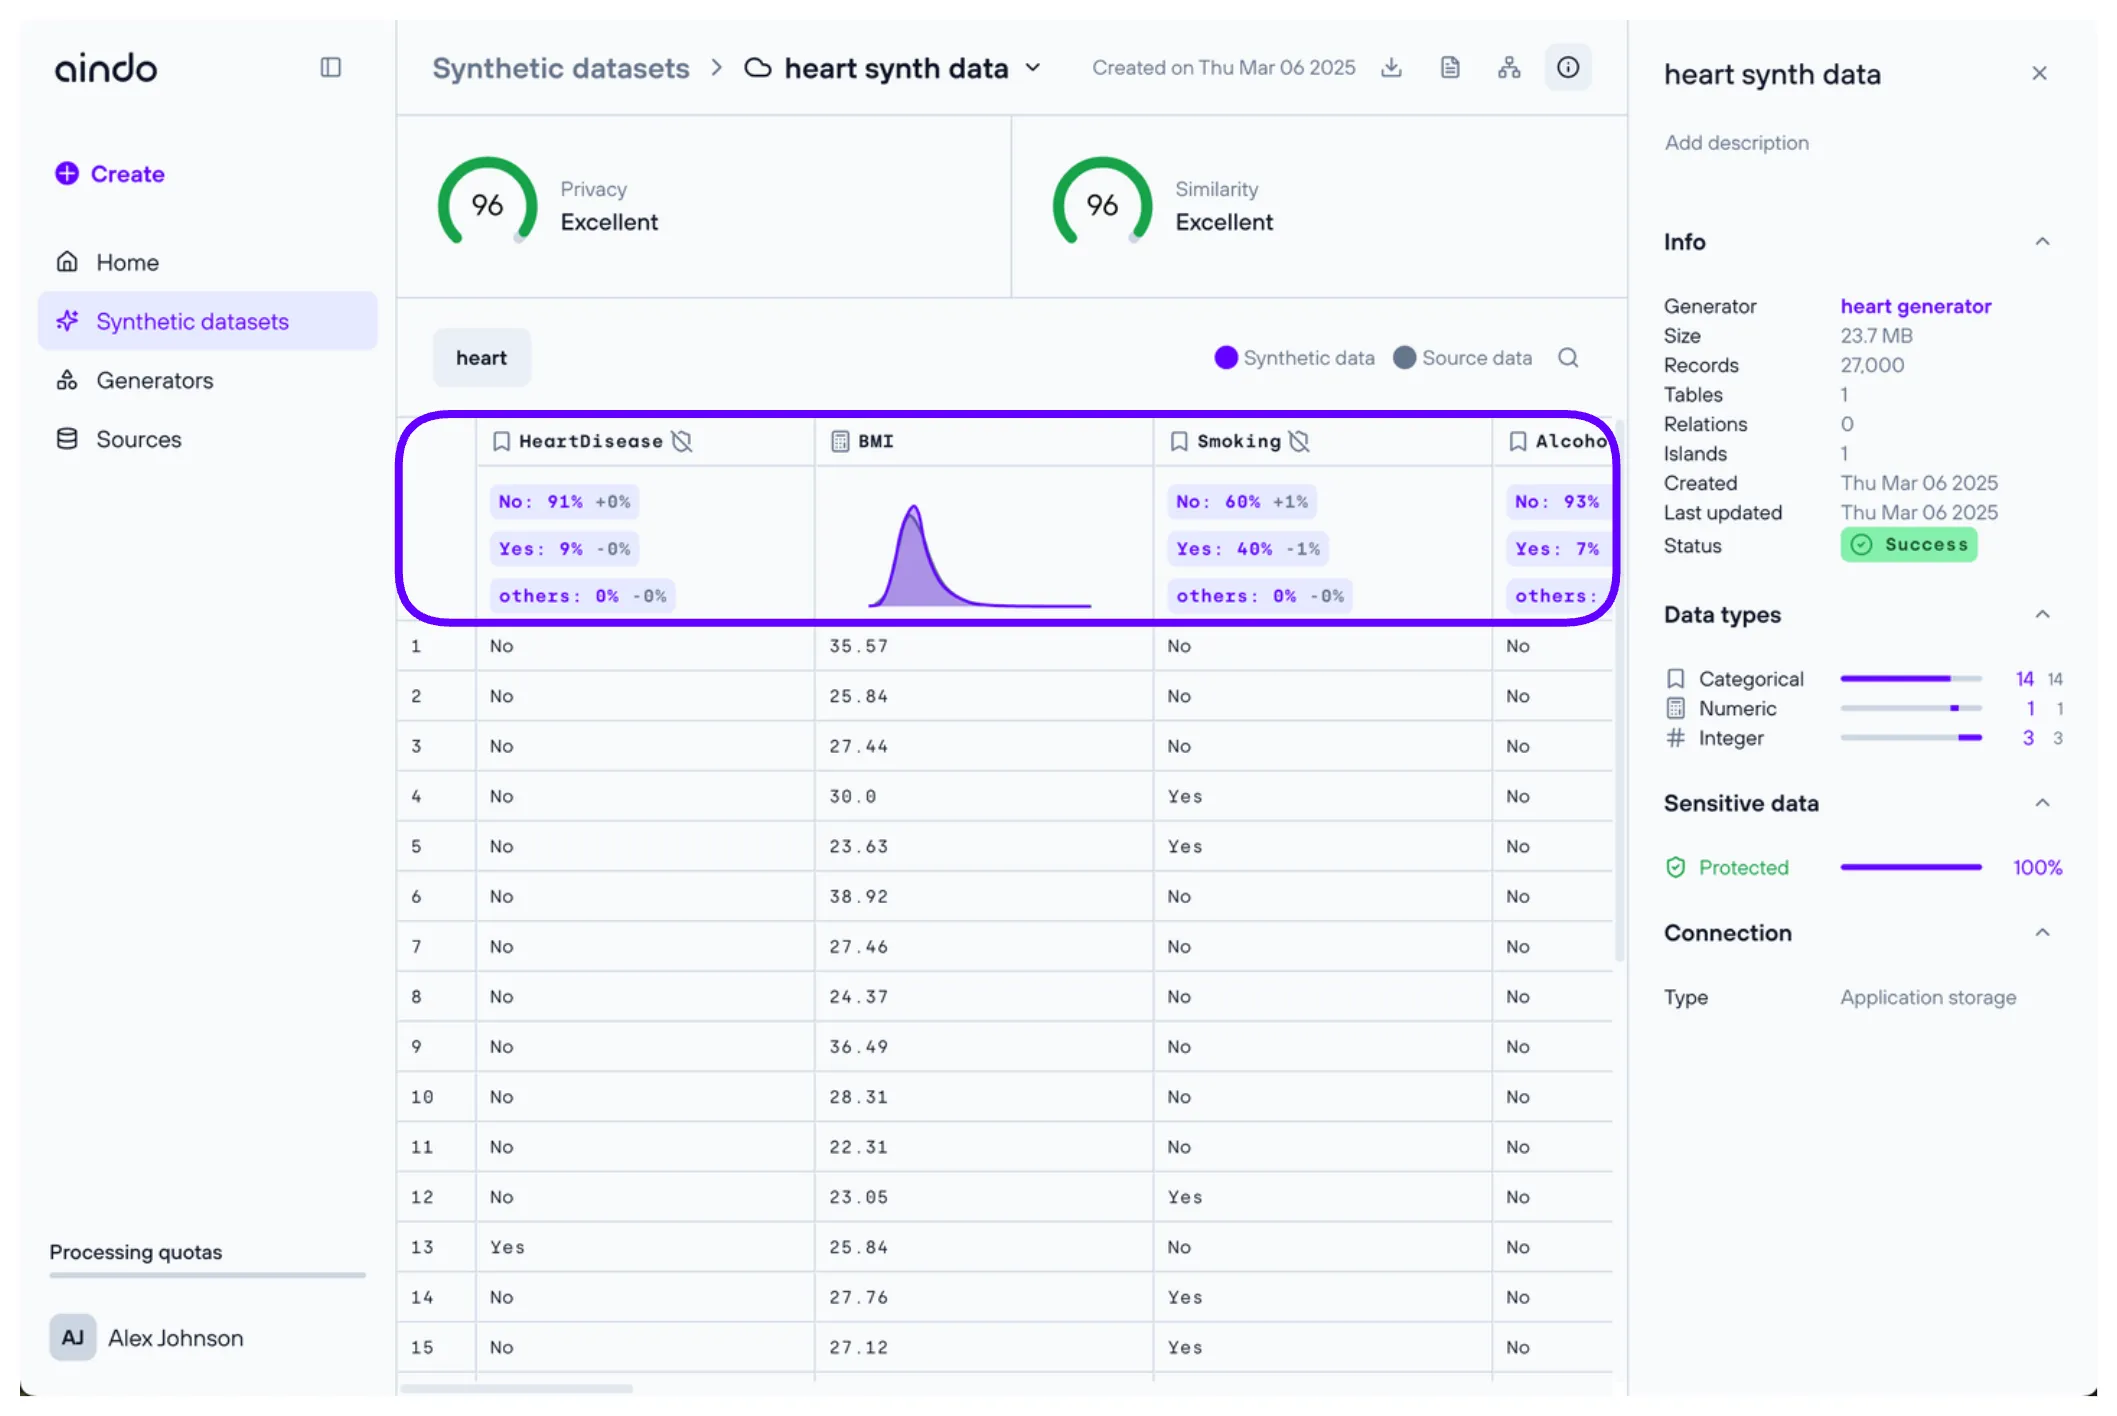
Below these metrics, you will find a preview of the synthesized data, similar to the source view page. Each column header includes an icon representing the column’s data type. If the original column contained sensitive data, a ‘shield’ icon is also displayed.
- A green shield icon indicates that you chose to synthesize the original sensitive data.
- A gray shield icon indicates that you chose not to synthesize the original sensitive data.
Under each column header, a small chart provides key statistics for that column and compares them with the source data.
Report
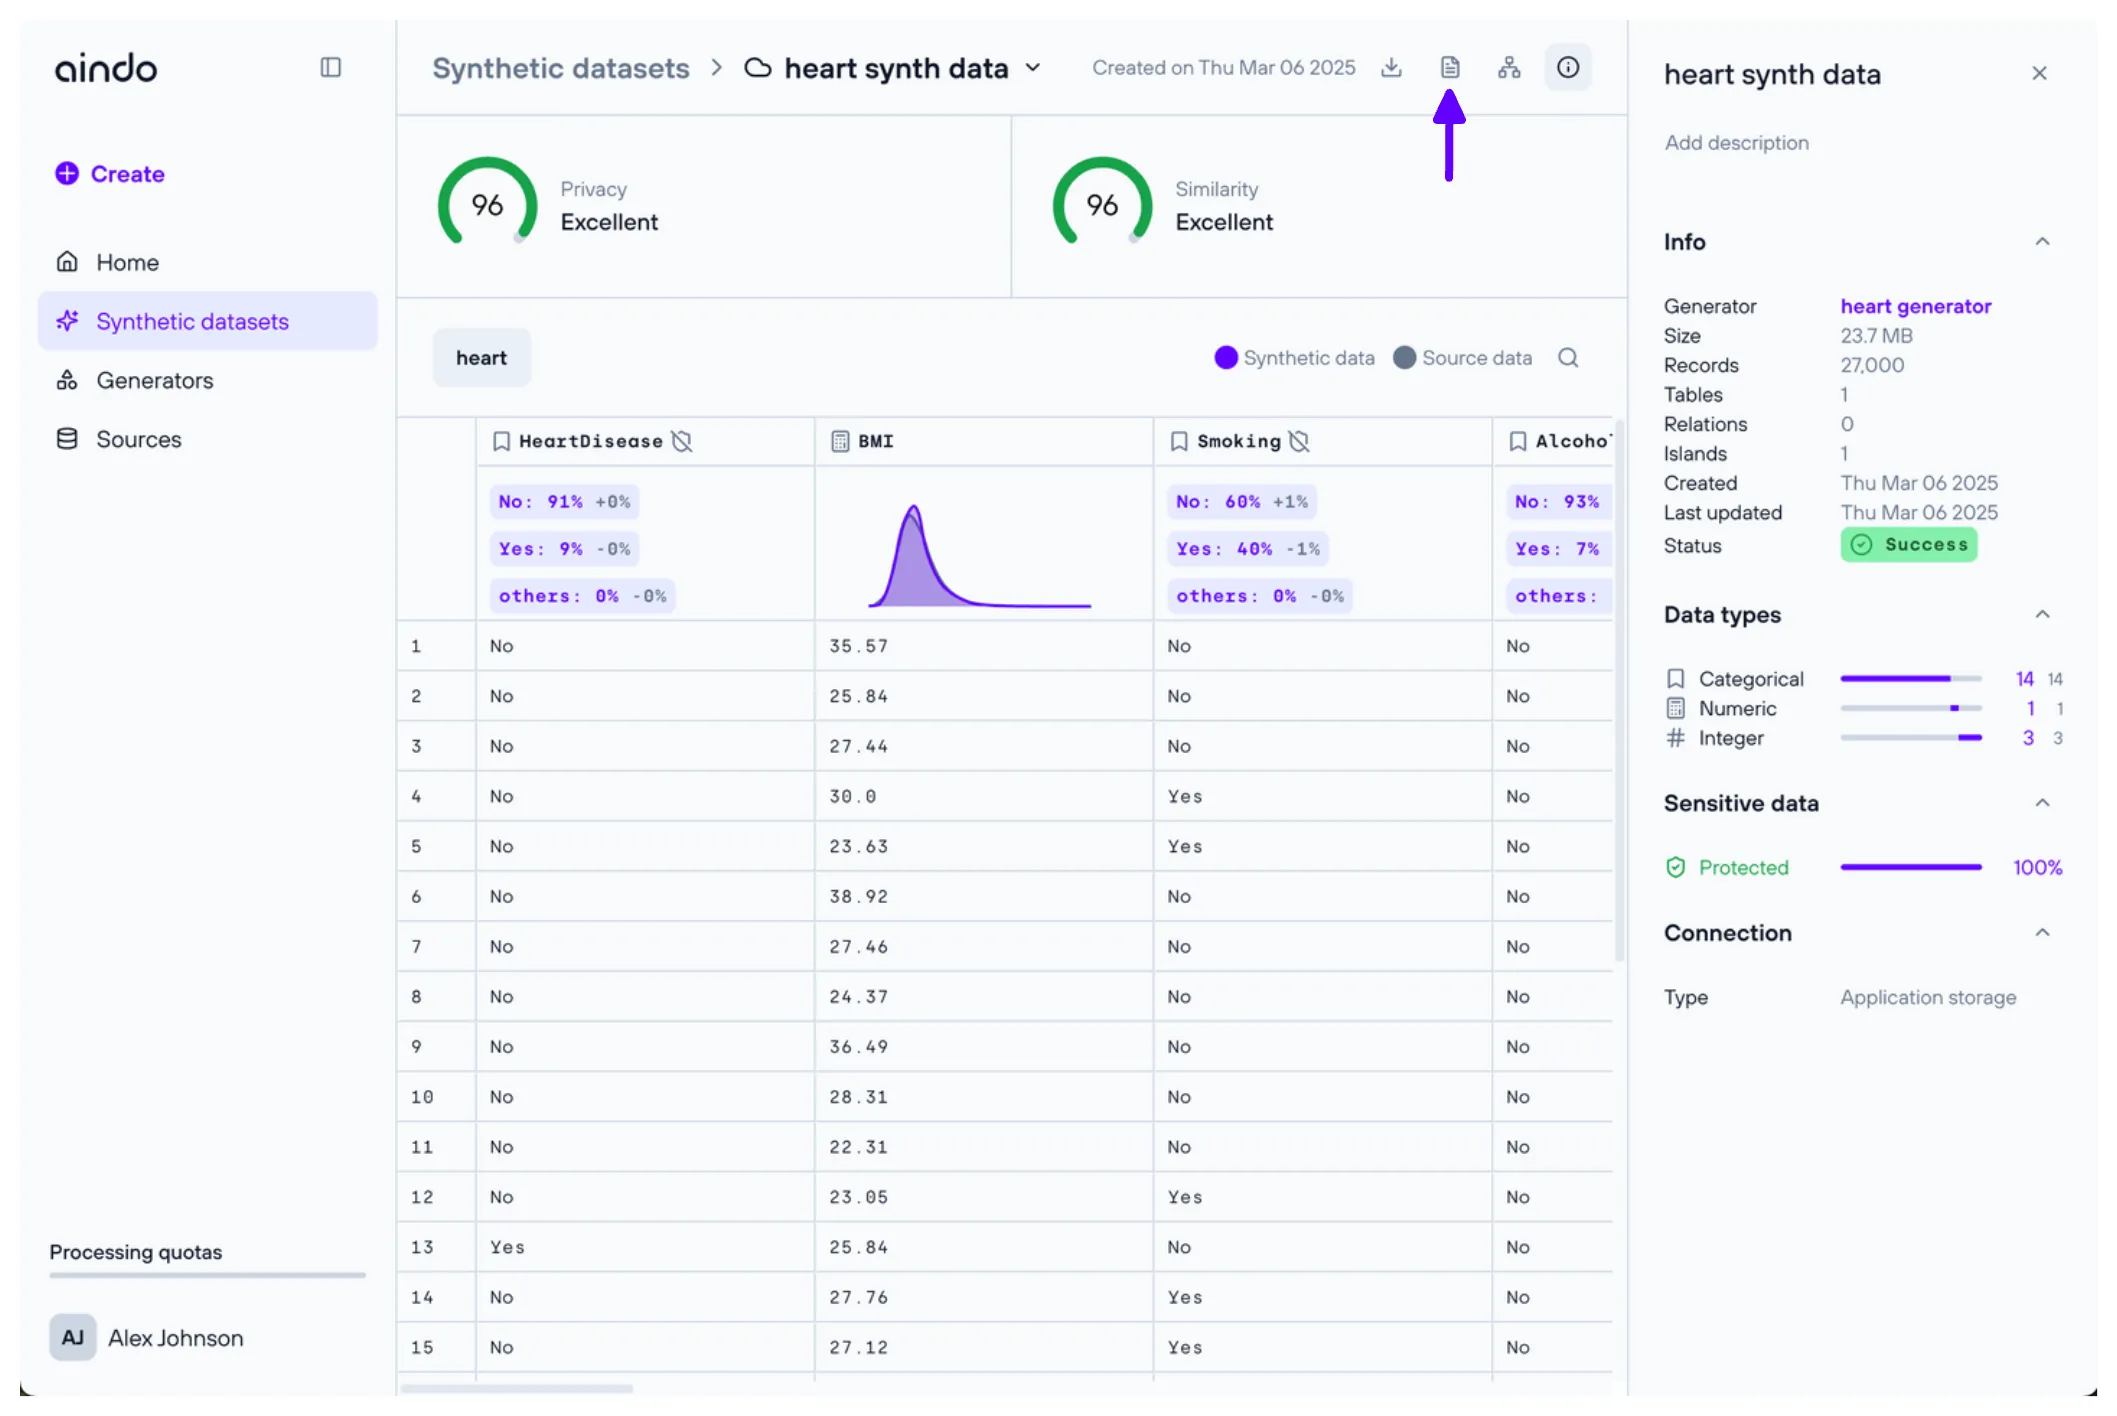
The report is a PDF containing detailed statistics to thoroughly compare the synthetic data with the original dataset. It helps evaluate the quality of the synthetic data.
To download the report, click the “Report” icon in the top right corner of the page.
Quick synthesis details
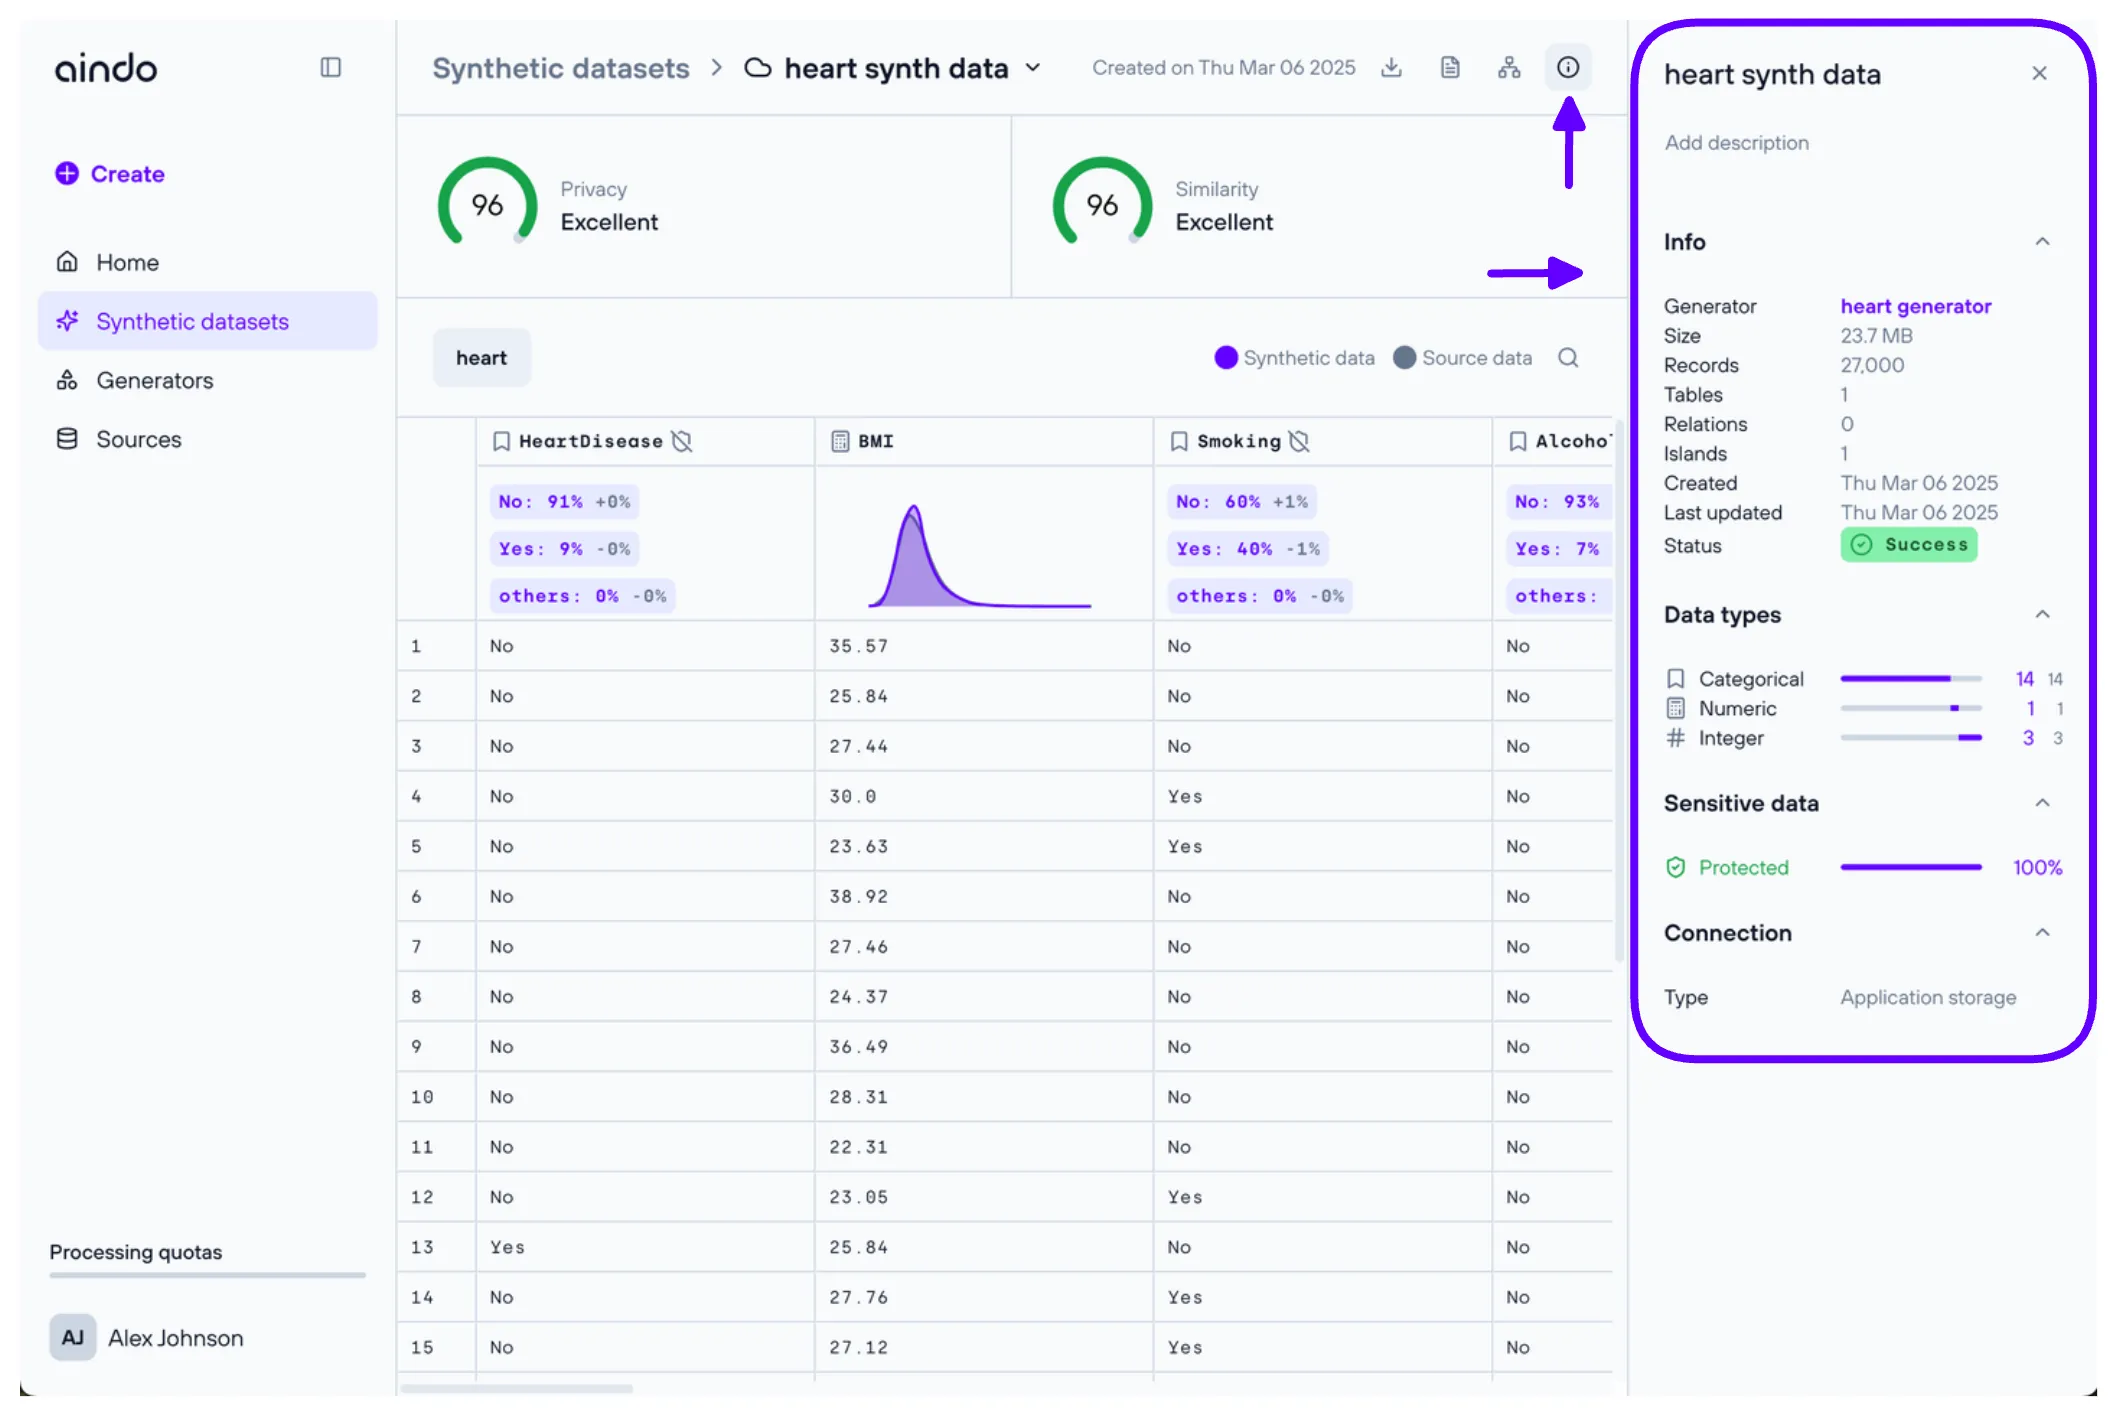
Click the “Info” icon in the top right corner to open a side panel with general details about the generated dataset.
Quick column details
Click on a column to open a side panel displaying detailed statistics and insights about the selected column.
Quick table details
Click on the table name to open a side panel with more in-depth information about the selected table.